Fig. 5.
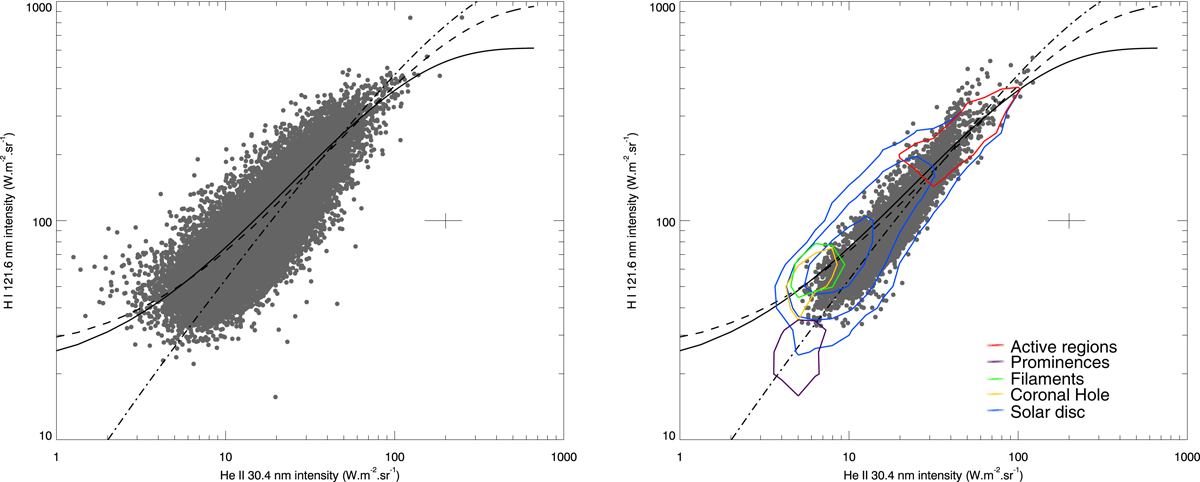
Download original image
Correlation between He II 30.4 nm and H I 121.6 nm for the September 3, 2015, data set (CLASP-SJ and AIA). The plot in the left panel corresponds to the 1.03 arcsec pixel−1 CLASP-SJ resolution, whereas the plot in the right panel has the 10 arcsec pixel−1 MXUVI resolution. The cross on the right of each plot indicates the error bars for each data point. The solid lines correspond to the fit shown in Fig. 4. The dot-dashed lines correspond to the fit of the CLASP (at MXUVI resolution) and AIA data. The dashed lines show the fit for both the MXUVI-EIT and CLASP-AIA data. The colored contours outline the intensity distributions for the different solar regions from Fig. 4.
Current usage metrics show cumulative count of Article Views (full-text article views including HTML views, PDF and ePub downloads, according to the available data) and Abstracts Views on Vision4Press platform.
Data correspond to usage on the plateform after 2015. The current usage metrics is available 48-96 hours after online publication and is updated daily on week days.
Initial download of the metrics may take a while.