Fig. 4.
Download original image
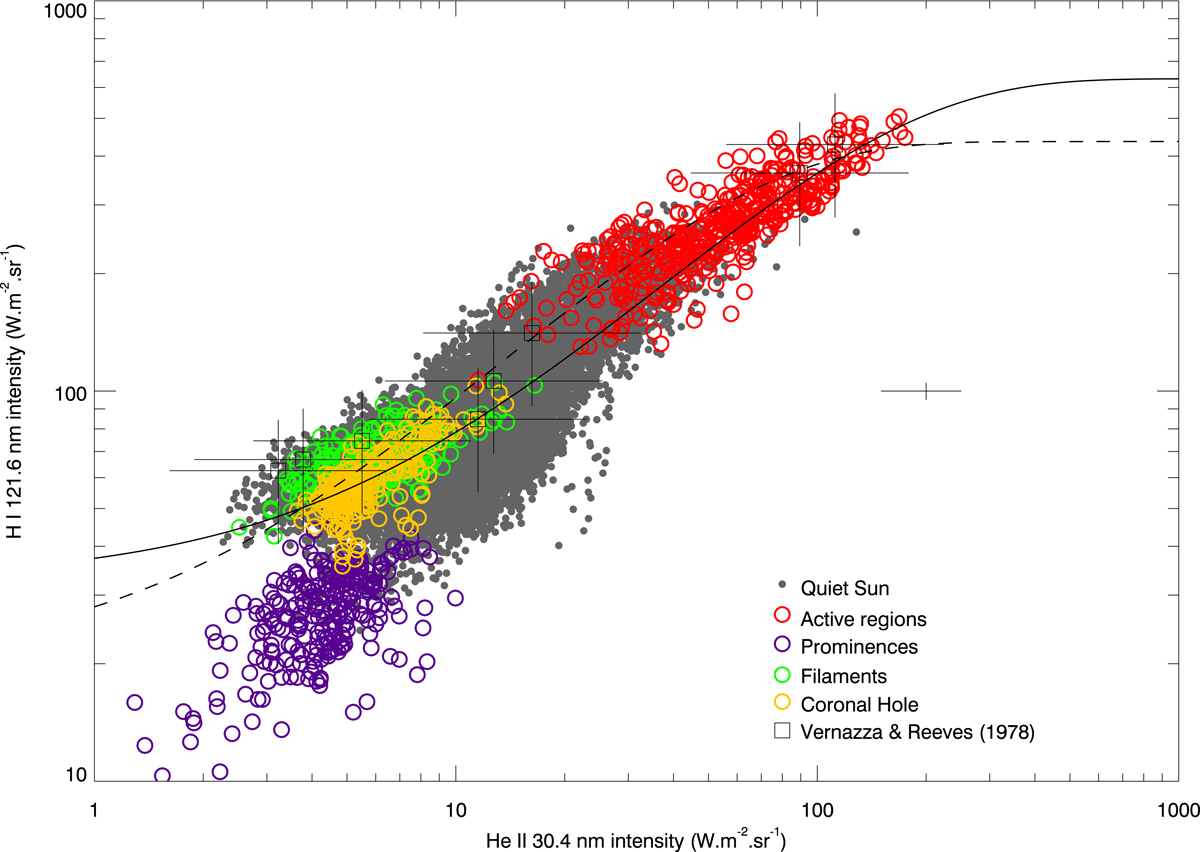
Correlation between He II 30.4 nm and H I 121.6 nm for the November 2, 1998, data set (MXUVI and EIT). The cross on the right indicates the error bars for each data point. The different colored circles on the plot correspond to the intensities of the colored contours in the EIT image (Fig. 1). The dark squares are the Vernazza & Reeves (1978) data from Skylab, shown with their error bars. The solid line fits the MXUVI and EIT data. The dashed line corresponds to the fit from Auchère (2005).
Current usage metrics show cumulative count of Article Views (full-text article views including HTML views, PDF and ePub downloads, according to the available data) and Abstracts Views on Vision4Press platform.
Data correspond to usage on the plateform after 2015. The current usage metrics is available 48-96 hours after online publication and is updated daily on week days.
Initial download of the metrics may take a while.