Fig. A.3.
Download original image
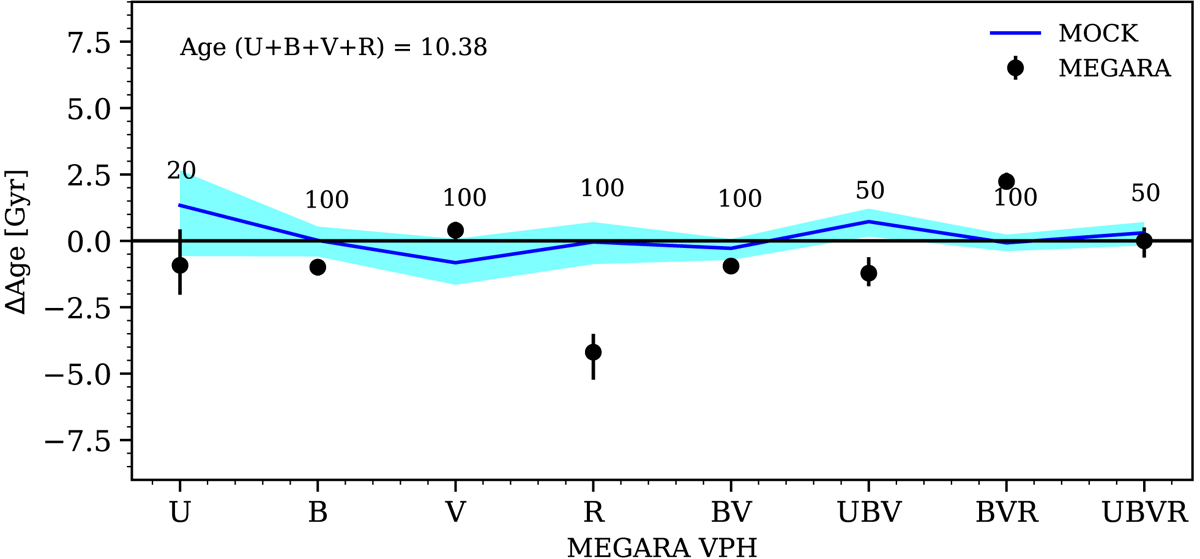
Age differences obtained from the different MEGARA setups with the age obtained from the observations of the 4 low-resolution VPHs we use in this paper (LR-U+LR-B+LR-V+LR-R) concatenated. Black points represent the ages obtained using MEGARA data from the innermost elliptical region of NGC 7025 taken with different VPHs combinations, all referenced to the rightmost point, which was obtained using LR-U+LR-B+LR-V+LR-R data. The error bars represent the dispersion of the results at 1σ. The solid blue line and shaded areas represent the mean and 1σ differences relative to the corresponding SSP mock model age. The numbers labelled in this plot represent the signal-to-noise ratios of the mock models we considered, which are also most similar to those reached with our NGC 7025 observations.
Current usage metrics show cumulative count of Article Views (full-text article views including HTML views, PDF and ePub downloads, according to the available data) and Abstracts Views on Vision4Press platform.
Data correspond to usage on the plateform after 2015. The current usage metrics is available 48-96 hours after online publication and is updated daily on week days.
Initial download of the metrics may take a while.