Free Access
Fig. 2.
Download original image
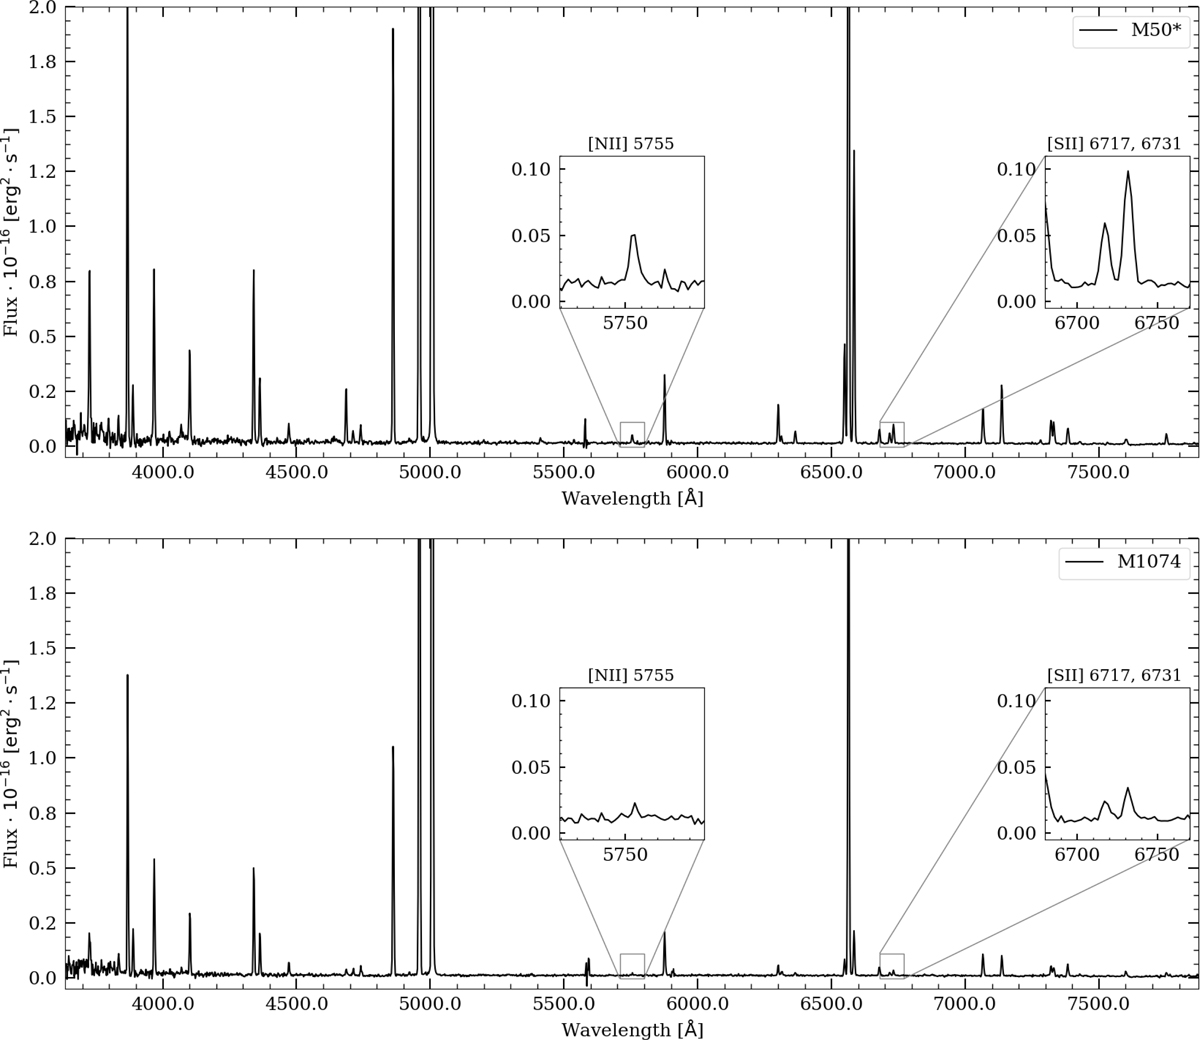
GTC OSIRIS 1D spectra of two of the sampled PNe plotted on the same scale and showing the best and worst S/N achieved in key diagnostic faint lines. Top: spectrum of the bright M50* PN. Bottom: spectrum of the control M1074 PN.
Current usage metrics show cumulative count of Article Views (full-text article views including HTML views, PDF and ePub downloads, according to the available data) and Abstracts Views on Vision4Press platform.
Data correspond to usage on the plateform after 2015. The current usage metrics is available 48-96 hours after online publication and is updated daily on week days.
Initial download of the metrics may take a while.