Free Access
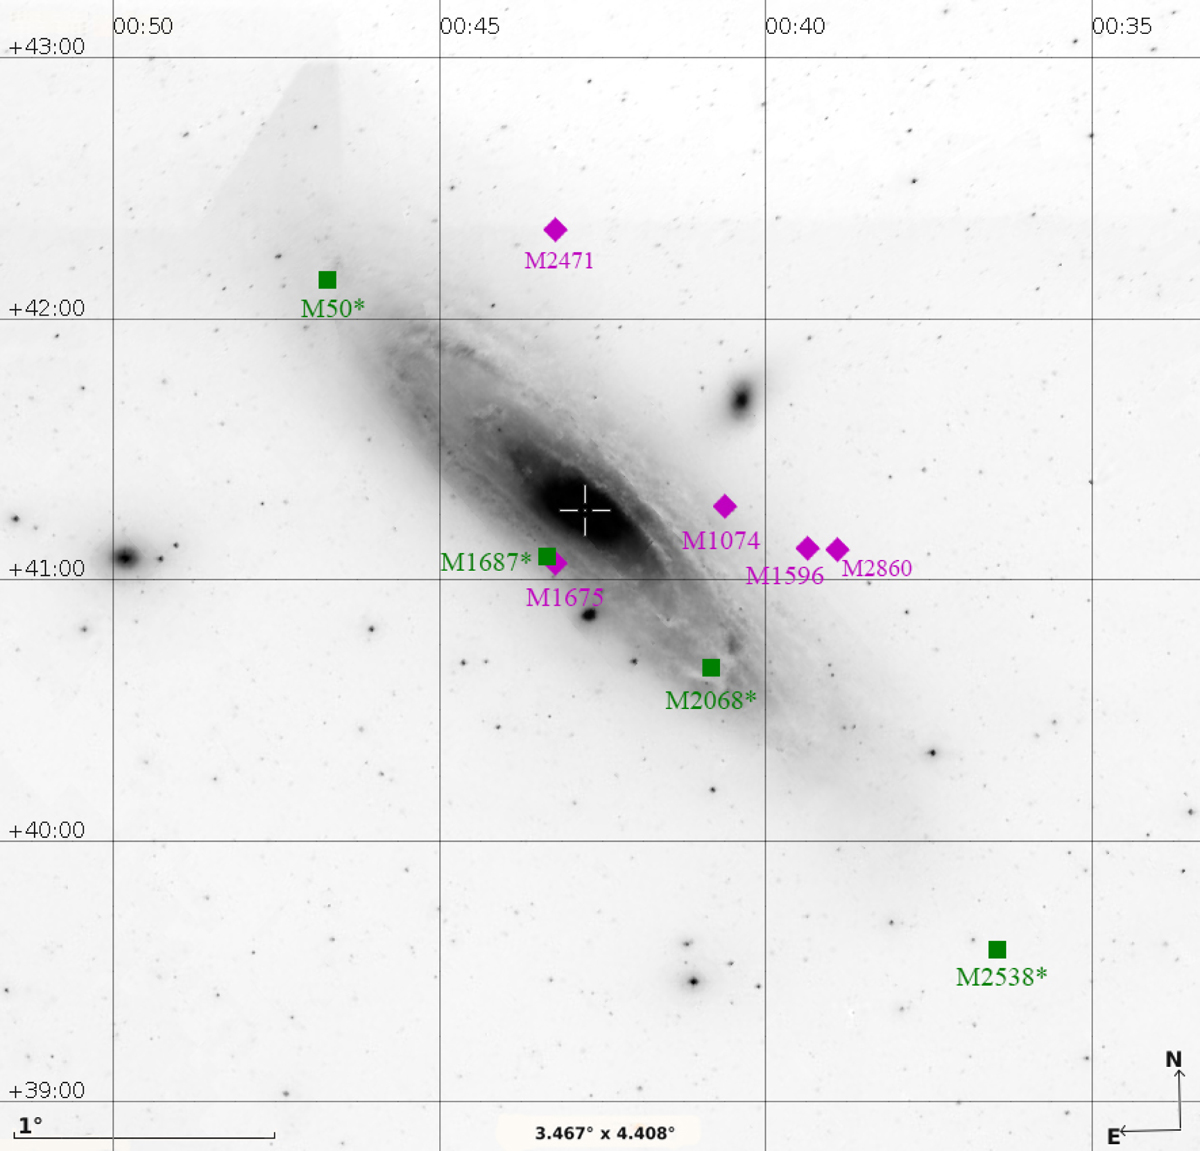
Fig. 1.
Download original image
Location of the target PNe. North is up, and east is to the left. Green squares correspond to the brightest sample targets and magenta diamonds to the control sample. More details are given in the text.
Current usage metrics show cumulative count of Article Views (full-text article views including HTML views, PDF and ePub downloads, according to the available data) and Abstracts Views on Vision4Press platform.
Data correspond to usage on the plateform after 2015. The current usage metrics is available 48-96 hours after online publication and is updated daily on week days.
Initial download of the metrics may take a while.