Fig. 9
Download original image
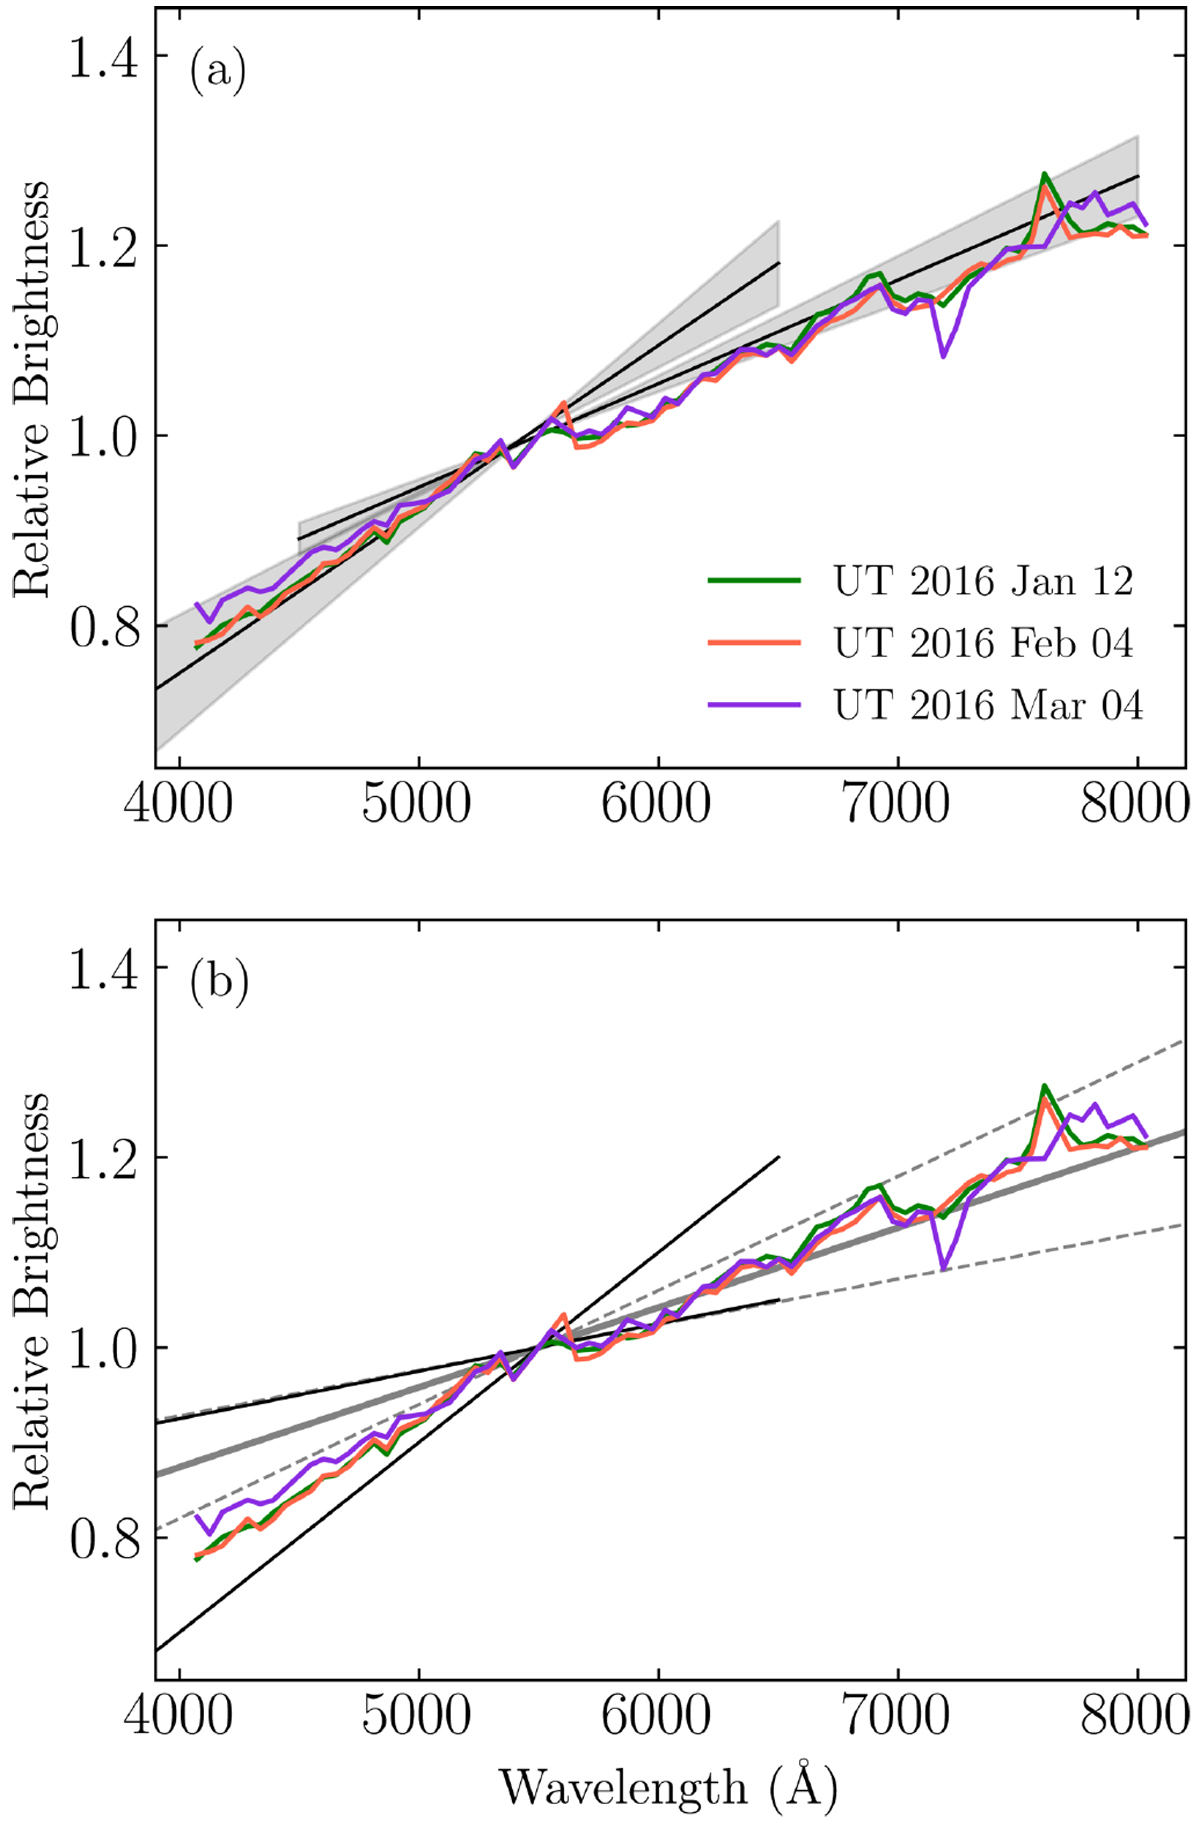
Relative brightness of 67P dust normalised at 5500 Å. (a) The dust colour slopes (Eq. (14)) are shown as the solid lines with 3σ fitting errors in grey regions. (b) Two solid black lines indicate the lower (5 ± 2% (1000 Å)-1) and upper (18 ± 2% (1000 Å)-1) reflectivity limits of the dust of nine comets over 3500–6500 Å, respectively (Jewitt & Meech 1986). The thick grey solid and dashed lines indicate the average reflectivity trend and standard deviation of 31 active comets (8.4 ± 3.6% (1000 Å)-1) over 3540–9050 Å used in Solontoi et al. (2012).
Current usage metrics show cumulative count of Article Views (full-text article views including HTML views, PDF and ePub downloads, according to the available data) and Abstracts Views on Vision4Press platform.
Data correspond to usage on the plateform after 2015. The current usage metrics is available 48-96 hours after online publication and is updated daily on week days.
Initial download of the metrics may take a while.