Fig. 8
Download original image
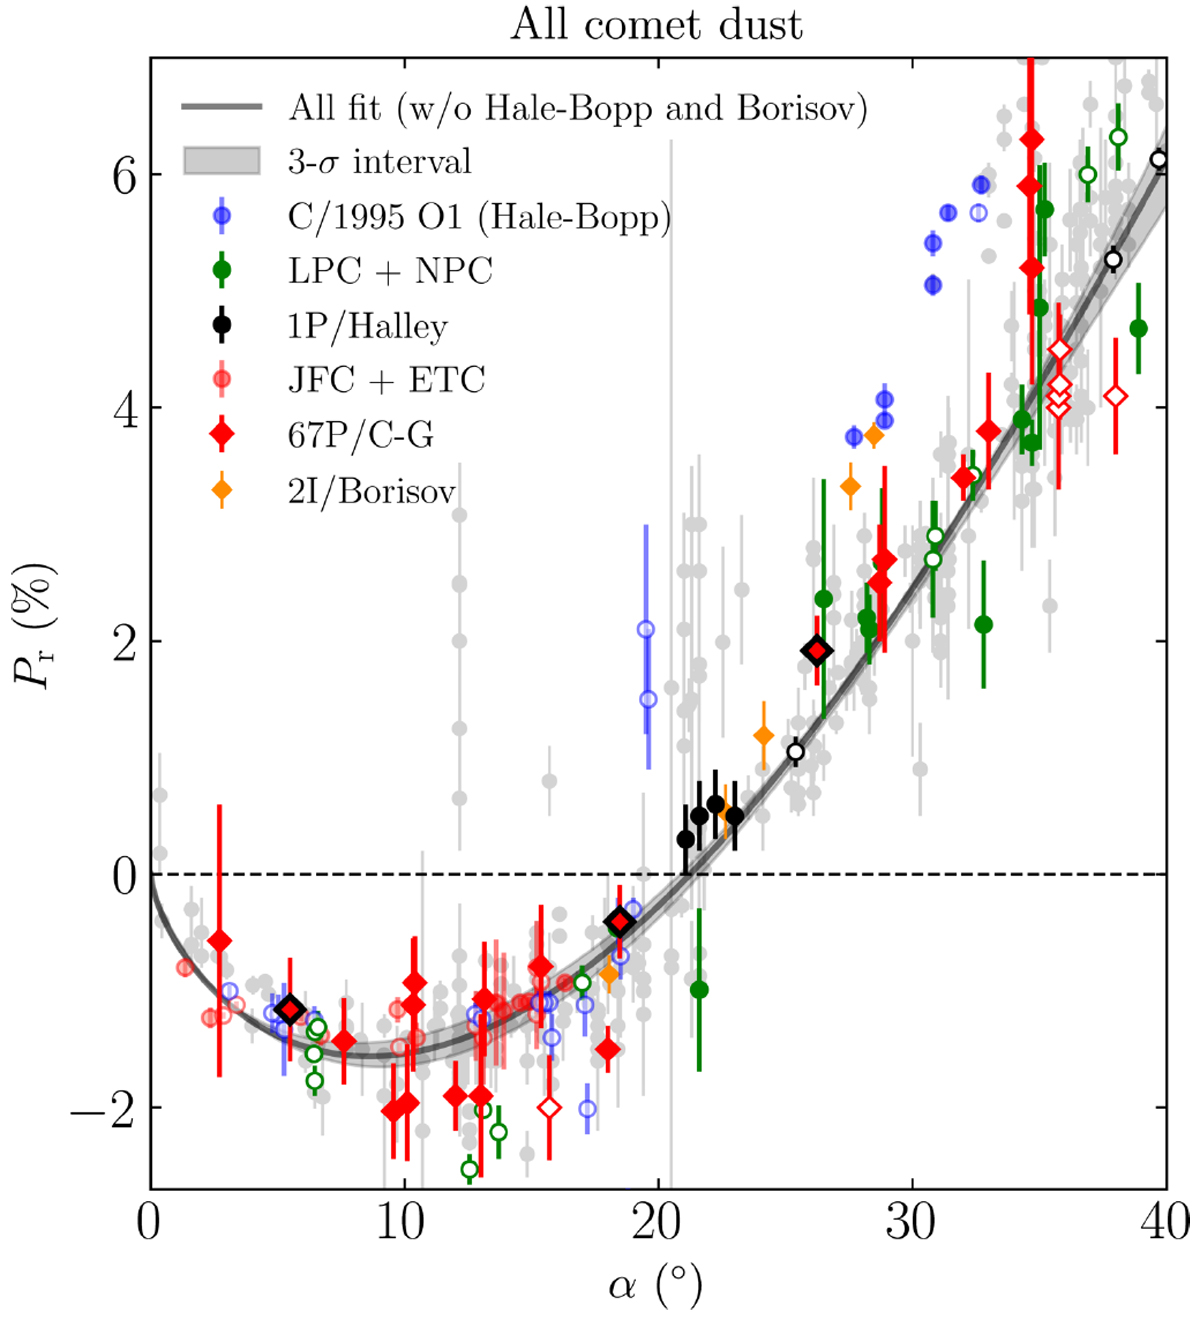
Polarisation of all available comets’ dust versus phase angle. The black solid line and shaded areas denote the average trend of the dependence and its 3σ error, respectively. As in Fig. 6, open and filled symbols denote the pre- and post-perihelion data, while background grey circles represent data points discarded from the fitting because of either their large aperture size (≫10 000 km in cometocentric distance) and/or the possible gas contamination. All symbols are the archival data of Kiselev et al. (2017), except for the four points of 2I/Borisov (Bagnulo et al. 2021) and three points of 67P (this study). We exclude unique comets C/1995 O1 (Hale-Bopp) and 2I/Borisov from the fitting, since their Pr has been found to be significantly higher. The red diamonds edged with black lines are our spectropolarimetric data. The best fit parameters of the fitted curve are b = 25.69 ± 1.27%, c1 = 0.67 ± 0.02, c2 = (1.54 ± 0.85) × 10-13, and α0 = 21°.25 ± 0°.14. A detailed description of the legend is provided in the text.
Current usage metrics show cumulative count of Article Views (full-text article views including HTML views, PDF and ePub downloads, according to the available data) and Abstracts Views on Vision4Press platform.
Data correspond to usage on the plateform after 2015. The current usage metrics is available 48-96 hours after online publication and is updated daily on week days.
Initial download of the metrics may take a while.