Fig. 7
Download original image
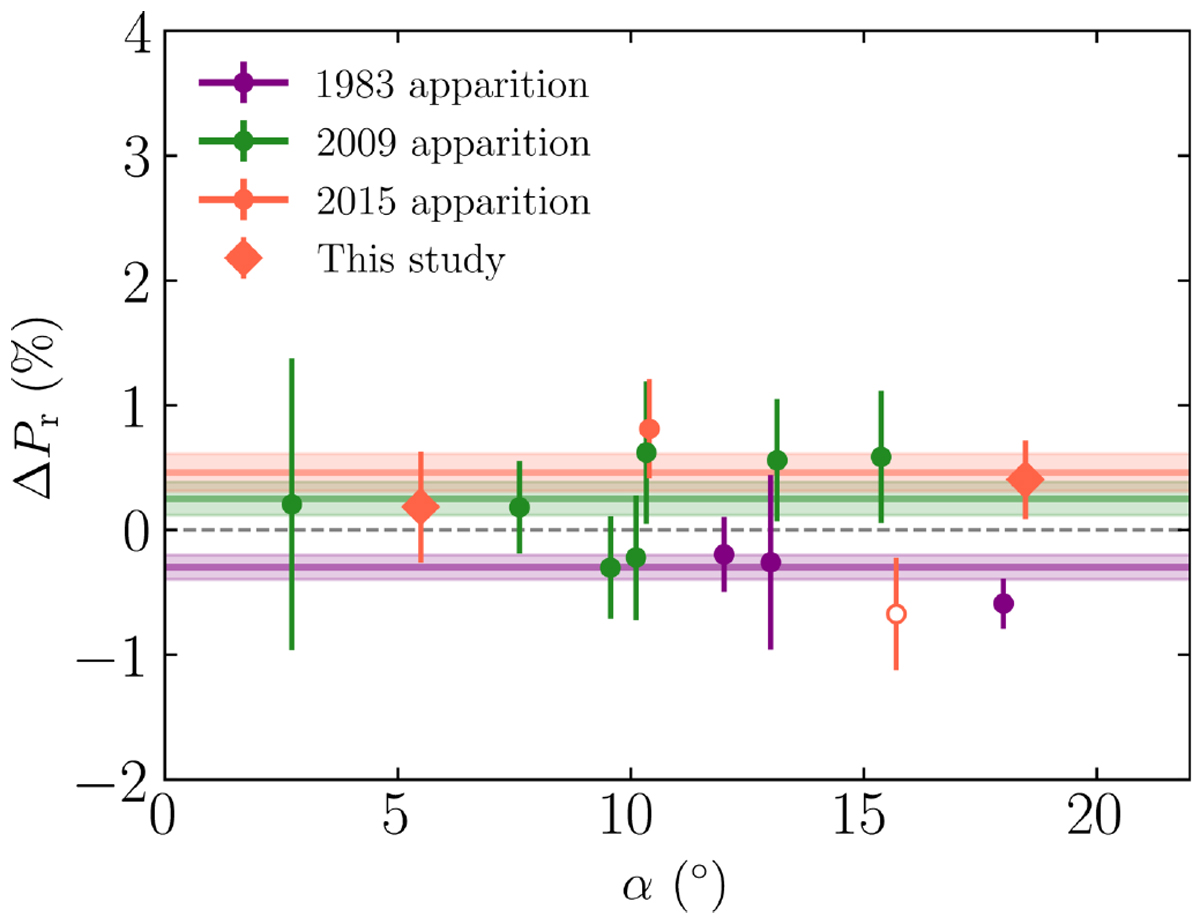
Departure of the Pr of 67P dust in each apparition from to the average trend. The black fitting line in Fig. 6 now corresponds to the horizontal dashed lines at ΔPr = 0. The horizontal solid lines and shaded areas denote the weighted mean and error, in which the colour scheme follows the symbols in the legend. Open and filled symbols denote the pre- and post-perihelion data of 67P dust. Only post-perihelion data were used to estimate ΔPr.
Current usage metrics show cumulative count of Article Views (full-text article views including HTML views, PDF and ePub downloads, according to the available data) and Abstracts Views on Vision4Press platform.
Data correspond to usage on the plateform after 2015. The current usage metrics is available 48-96 hours after online publication and is updated daily on week days.
Initial download of the metrics may take a while.