Fig. 6
Download original image
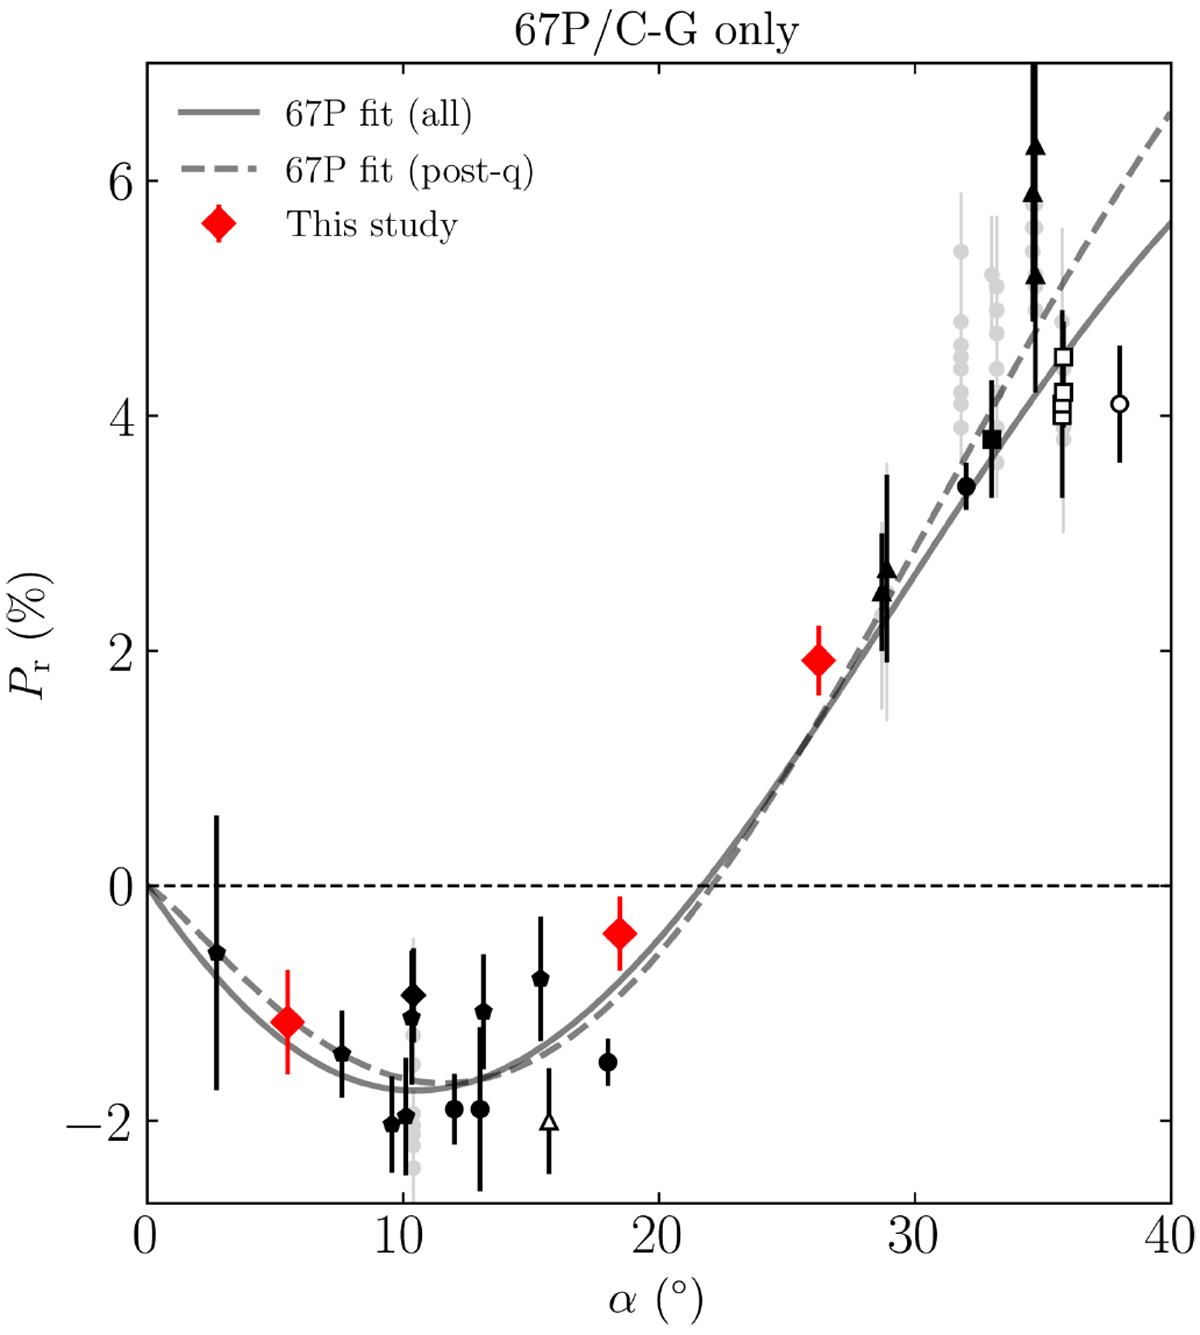
Polarisation of 67P dust versus phase angle. Open and filled symbols denote the pre- and post-perihelion data, respectively. Black symbols are the archival data (Kiselev et al. 2017) where different shapes indicate the datasets obtained by different works: circle (Myers & Nordsiseck 1984), square (Hadamcik et al. 2016), triangle (Hadamcik et al. 2010), polygon (Stinson et al. 2016), and diamond (Rosenbush et al. 2017). Red diamonds denote our spectropolarimetric data. Background grey symbols (Kiselev et al. 2017) are excluded from the analysis due to the significant difference in the aperture sizes from ours. The solid and dashed curves indicate the average dependence derived from Eq. (11) for the data as a whole and in post-perihelion, respectively. The best-fit parameters of the curves are provided in the text.
Current usage metrics show cumulative count of Article Views (full-text article views including HTML views, PDF and ePub downloads, according to the available data) and Abstracts Views on Vision4Press platform.
Data correspond to usage on the plateform after 2015. The current usage metrics is available 48-96 hours after online publication and is updated daily on week days.
Initial download of the metrics may take a while.