Fig. 2
Download original image
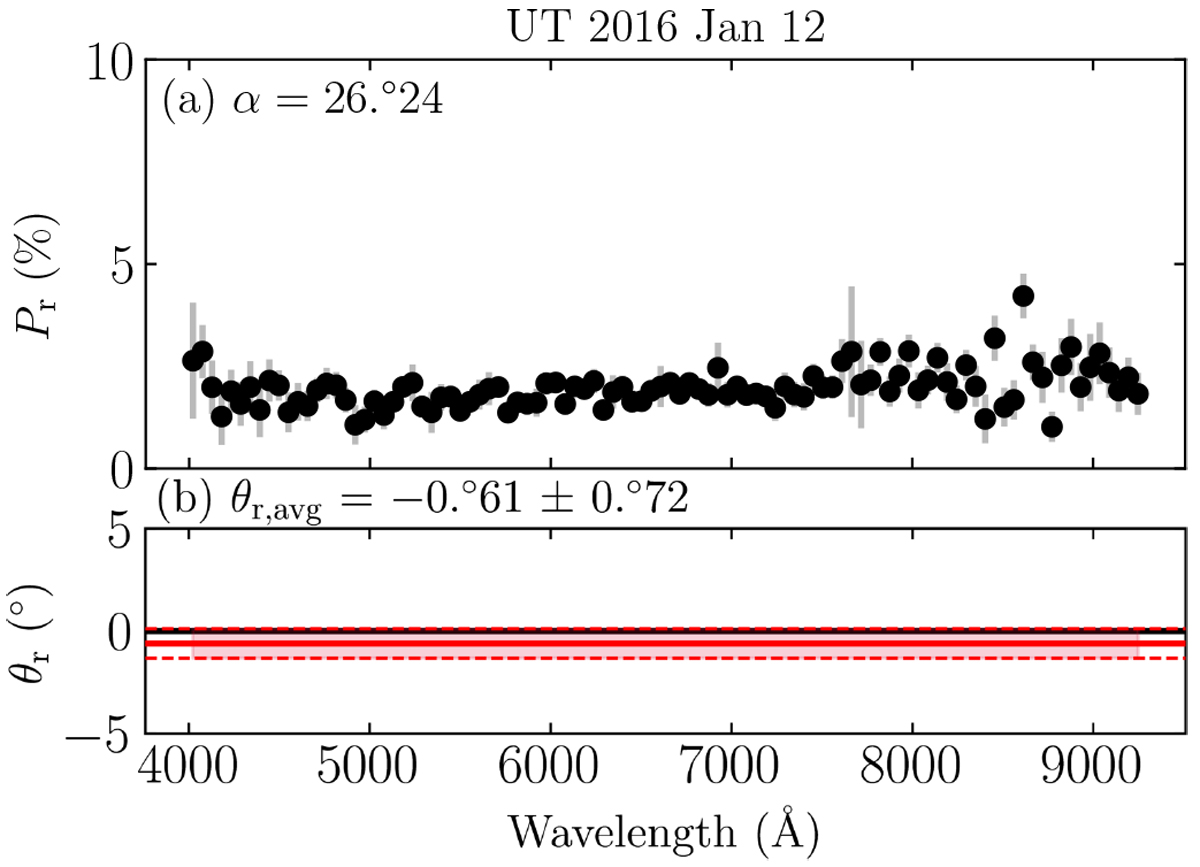
Pr of 67P dust in % (a) and the mean and 1σ error of the position angle of Pr with regard to the scattering plane (θr) as a functionof the wavelength (b) observed at α = 26°.4 on UT 2016 January 12. The black points in panel a were binned to have wavelength intervals of ~52 Å. The large error bars result from the remnants of the skylines that were not perfectly subtracted due to the limited slitwidth. The red solid and upper and lower dashed lines inpanel b indicate the weighted mean of θr (θr, avg) and its error(the standard deviation divided by the square of the number of the data points), respectively. The black line marks θr = 0°, the expected value when the dust is distributed randomly in the coma.
Current usage metrics show cumulative count of Article Views (full-text article views including HTML views, PDF and ePub downloads, according to the available data) and Abstracts Views on Vision4Press platform.
Data correspond to usage on the plateform after 2015. The current usage metrics is available 48-96 hours after online publication and is updated daily on week days.
Initial download of the metrics may take a while.