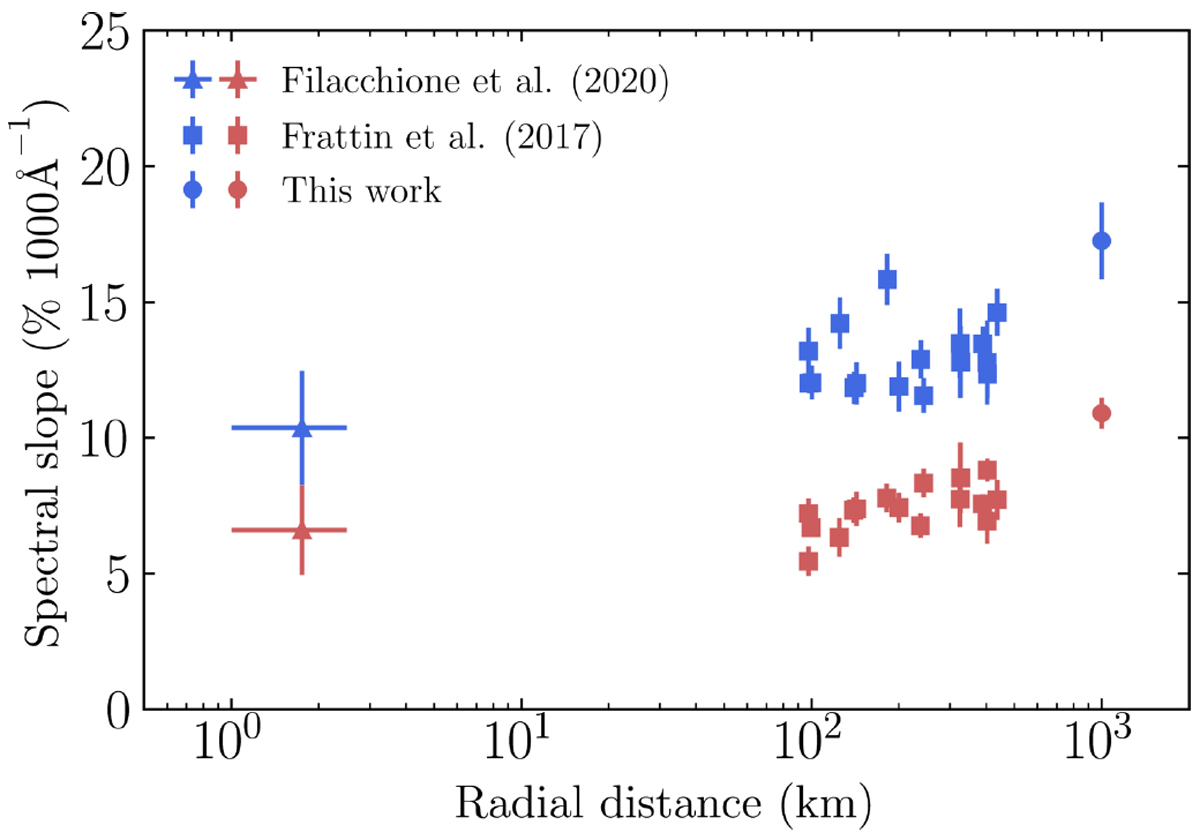
Fig. 11

Download original image
Radial evolution of the spectral slope of the dust particles of 67P in % (1000 Å)-1. Circles indicate the average value of our three-epoch colour data (Fig. 9a). Blue and red symbols indicate spectral slopes measured at wavelengths shortward and longward of the inflection point. Horizontal error bars of triangles span the cometocentric distance (1.0–2.5 km) VIRTIS covered, while their vertical error bars denote the error of the weighted mean of observations (i.e. the standard deviation divided by the square root of the number of the data points) between UT2016 January and early March.
Current usage metrics show cumulative count of Article Views (full-text article views including HTML views, PDF and ePub downloads, according to the available data) and Abstracts Views on Vision4Press platform.
Data correspond to usage on the plateform after 2015. The current usage metrics is available 48-96 hours after online publication and is updated daily on week days.
Initial download of the metrics may take a while.


