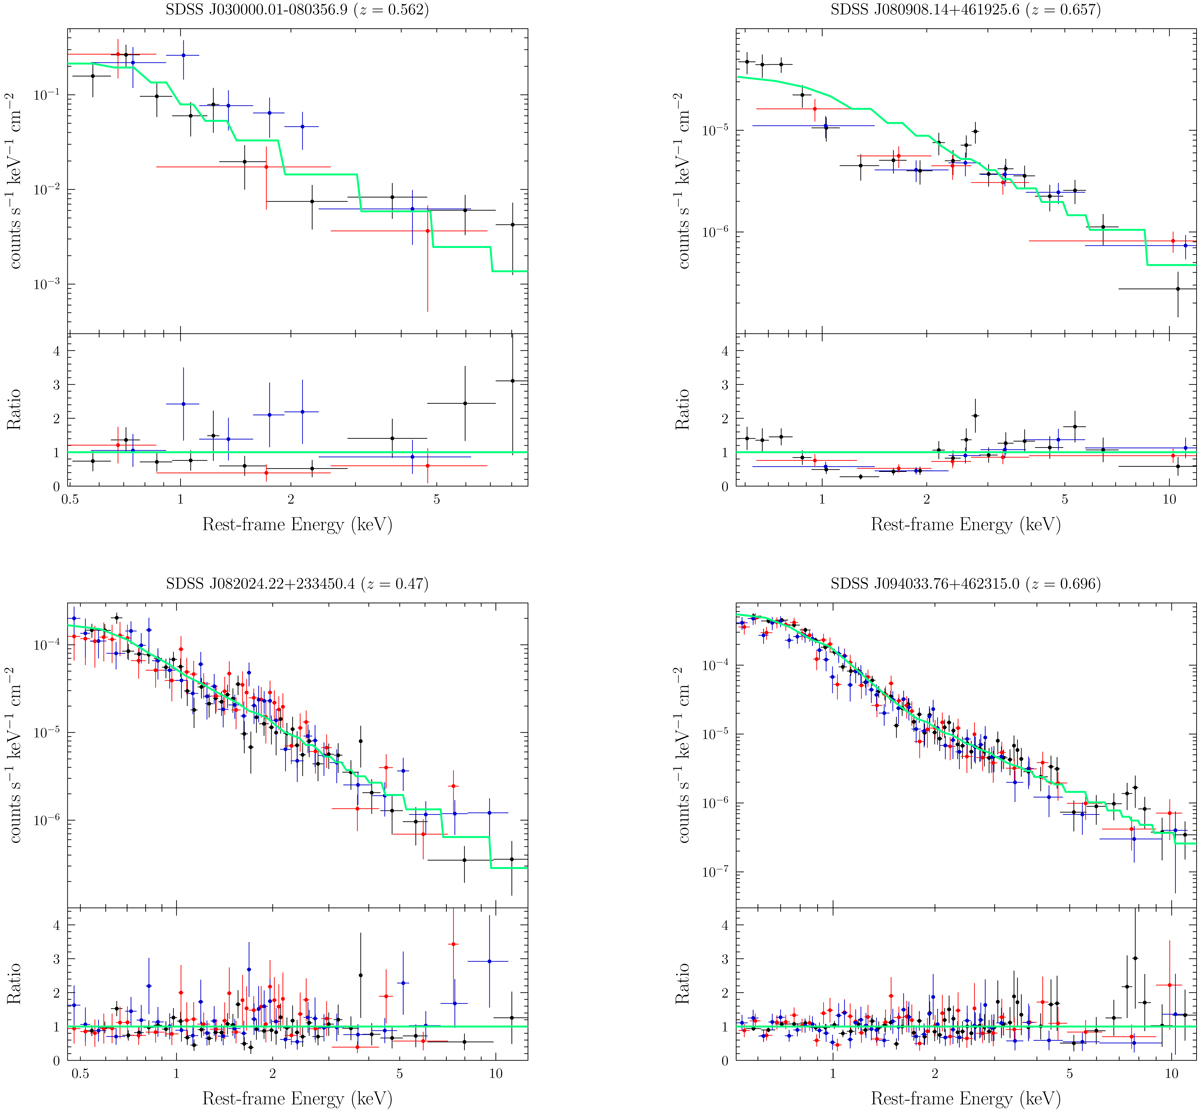
Fig. A.1.
Download original image
XMM-Newton spectra of the 14 high-λEdd quasars analysed in this paper. For each source, the top panel shows the X-ray spectrum (data from pn, MOS1, and MOS2 are indicated as black, red, and blue points, respectively) and the corresponding best-fit model (solid green line). The bottom panel shows the ratio between the data points and the best-fit model, except for J0809+46, whose spectrum is dominated by an absorption feature in the soft X-rays. To highlight the presence of this component, for this source the extension of the best fitting hard X-ray continuum power-law model to the soft X-ray portion is shown. Furthermore, for the quasar J1048+31, the inset figure displays the confidence contour plot of normalisation against rest-frame energy of the Gaussian line component that accounts for Fe Kα emission.
Current usage metrics show cumulative count of Article Views (full-text article views including HTML views, PDF and ePub downloads, according to the available data) and Abstracts Views on Vision4Press platform.
Data correspond to usage on the plateform after 2015. The current usage metrics is available 48-96 hours after online publication and is updated daily on week days.
Initial download of the metrics may take a while.