Fig. 7.
Download original image
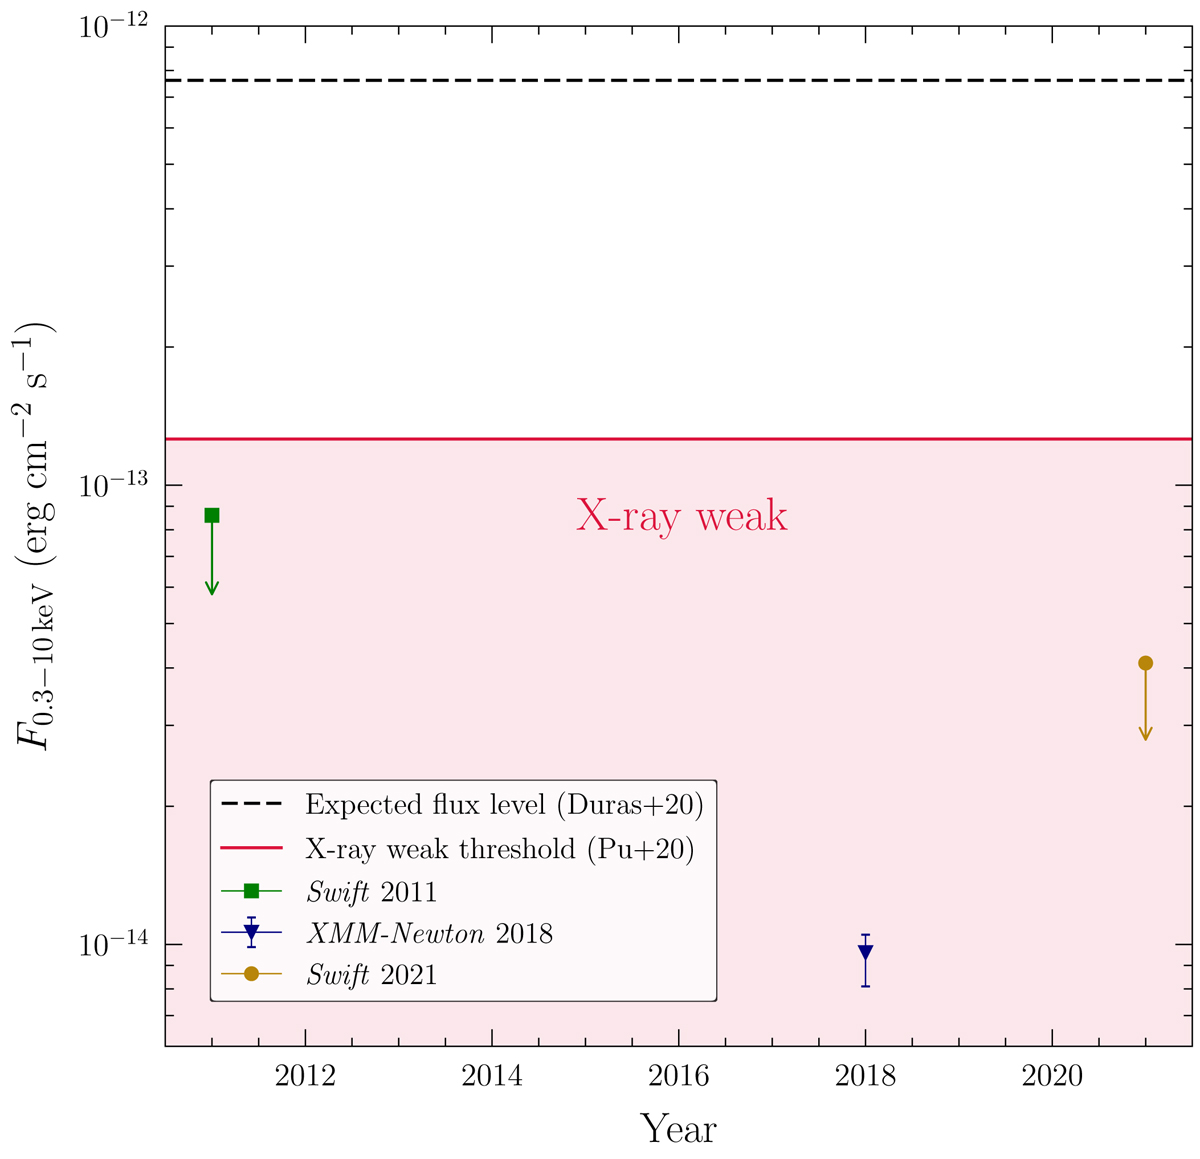
Light curve of J0300−08 in terms of the broadband E = 0.3 − 10 keV flux. The dashed black line represents the flux level of F0.3 − 10 keV = 7.6 × 10⁻¹³ erg cm−2 s−1 expected from its bolometric luminosity, once the kbol, X − log Lbol relation from Duras et al. (2020) is assumed. The solid red line indicates the flux reference value for X-ray weakness corresponding to Δαox ≤ −0.3 (Pu et al. 2020). The 3σ upper limits from the Swift observations of 2011 and 2021 are shown in green and gold, respectively. The flux from the 2018 XMM-Newton observation analysed in this work is marked in blue.
Current usage metrics show cumulative count of Article Views (full-text article views including HTML views, PDF and ePub downloads, according to the available data) and Abstracts Views on Vision4Press platform.
Data correspond to usage on the plateform after 2015. The current usage metrics is available 48-96 hours after online publication and is updated daily on week days.
Initial download of the metrics may take a while.