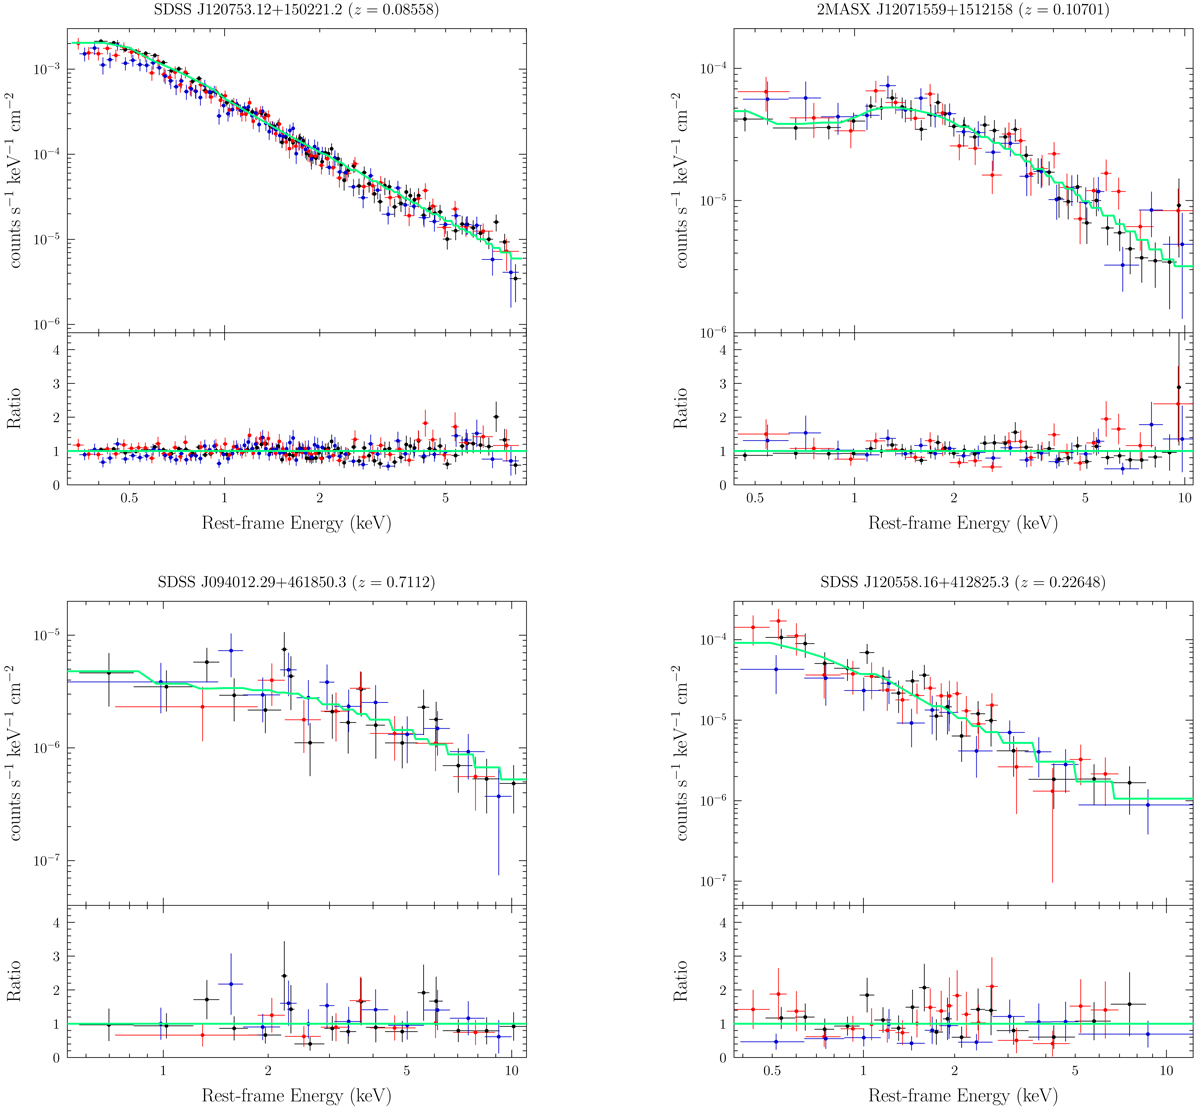
Fig. B.1.
Download original image
XMM-Newton spectra of the serendipitous sources described in Appendix B, with their corresponding best fit. Each top panel shows the X-ray spectrum and the best-fit line (in green). Each spectrum is re-binned for plotting purposes only. The bottom panels describe the ratio between the data points and the best-fit model. Data from EPIC-pn, MOS1, and MOS2 are shown in black, red, and blue, respectively.
Current usage metrics show cumulative count of Article Views (full-text article views including HTML views, PDF and ePub downloads, according to the available data) and Abstracts Views on Vision4Press platform.
Data correspond to usage on the plateform after 2015. The current usage metrics is available 48-96 hours after online publication and is updated daily on week days.
Initial download of the metrics may take a while.