Fig. 8
Download original image
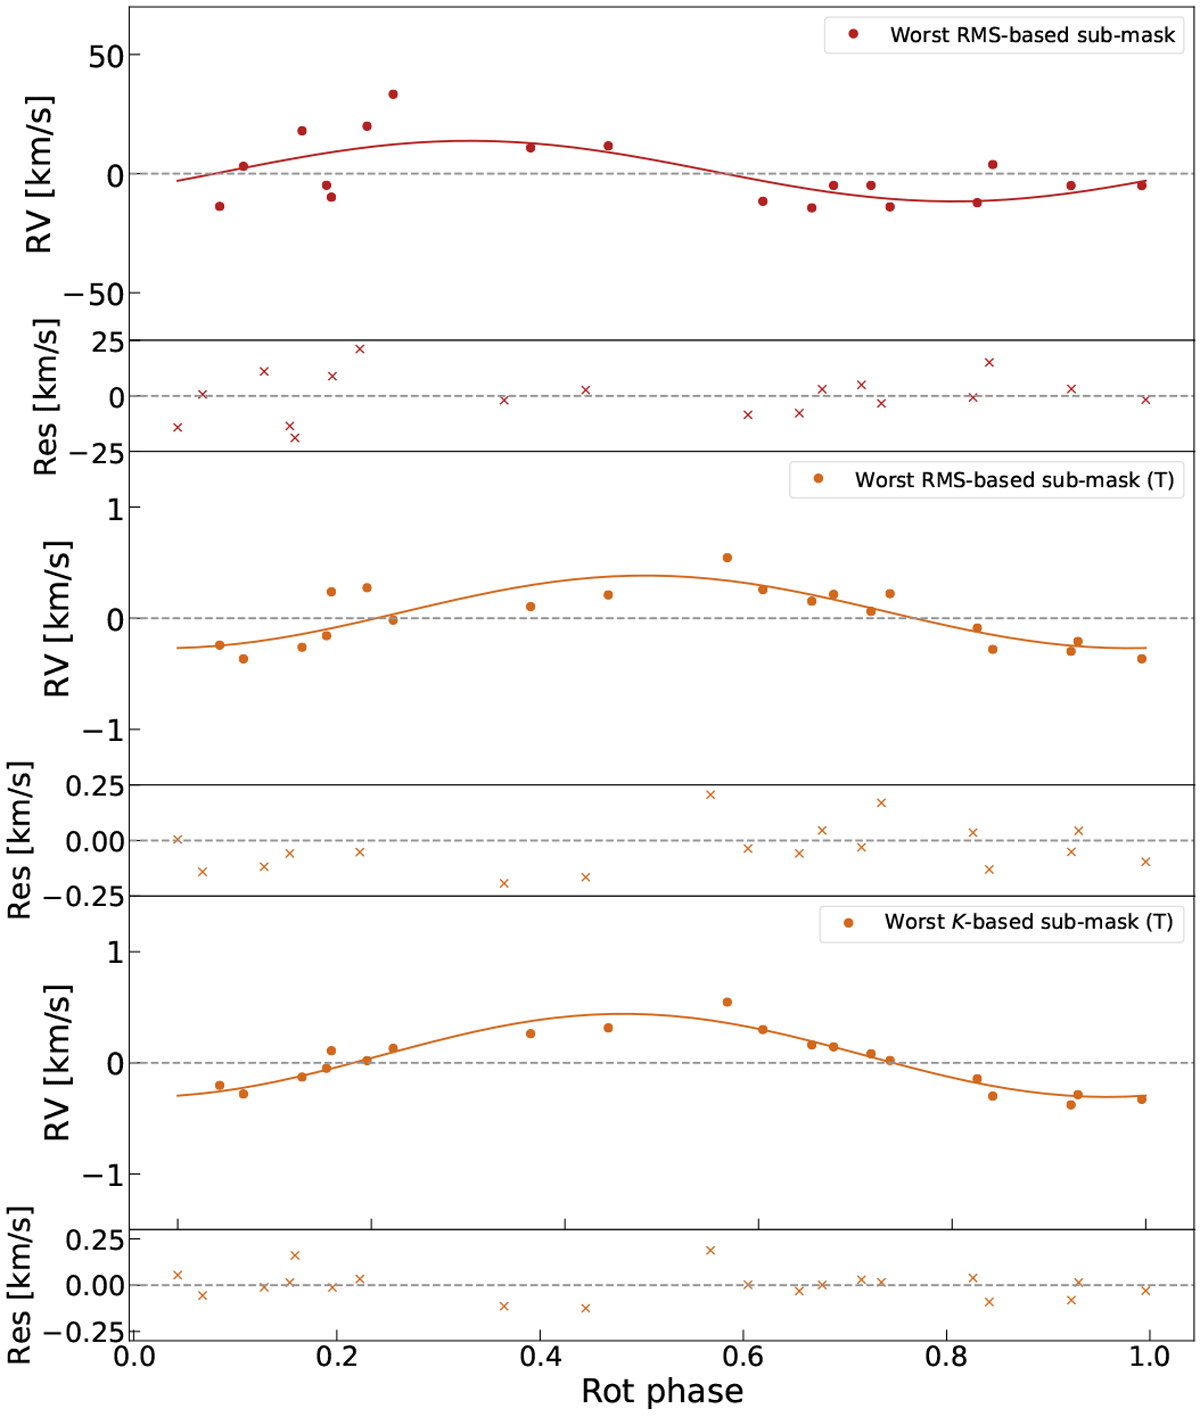
Phase-folded plot of the 2010 RV time series of EV Lac computed with: the worst RMS-based sub-mask including telluric windows (top), the worst RMS-based sub-mask discarding telluric windows (middle), and the worst K-based sub-mask discarding telluric windows (bottom). The symbol “T” indicates that the telluric windows are removed from the start. The first case demonstrates how lines falling in telluric windows severely contaminate the RV measurements and thus prevent a precise selection of the worst sub-mask. The second case illustrates the improvement in finding the worst sub-mask containing activity-sensitive lines, providing a clear rotational modulation of the data set. The third case shows how selecting the sub-masks based on the RV semi-amplitude, i.e. a feature that is directly connected to activity, yields the most precise selection of activity-sensitive lines. The sinusoidal fit in each panel is computed analogously to Fig. 6.
Current usage metrics show cumulative count of Article Views (full-text article views including HTML views, PDF and ePub downloads, according to the available data) and Abstracts Views on Vision4Press platform.
Data correspond to usage on the plateform after 2015. The current usage metrics is available 48-96 hours after online publication and is updated daily on week days.
Initial download of the metrics may take a while.