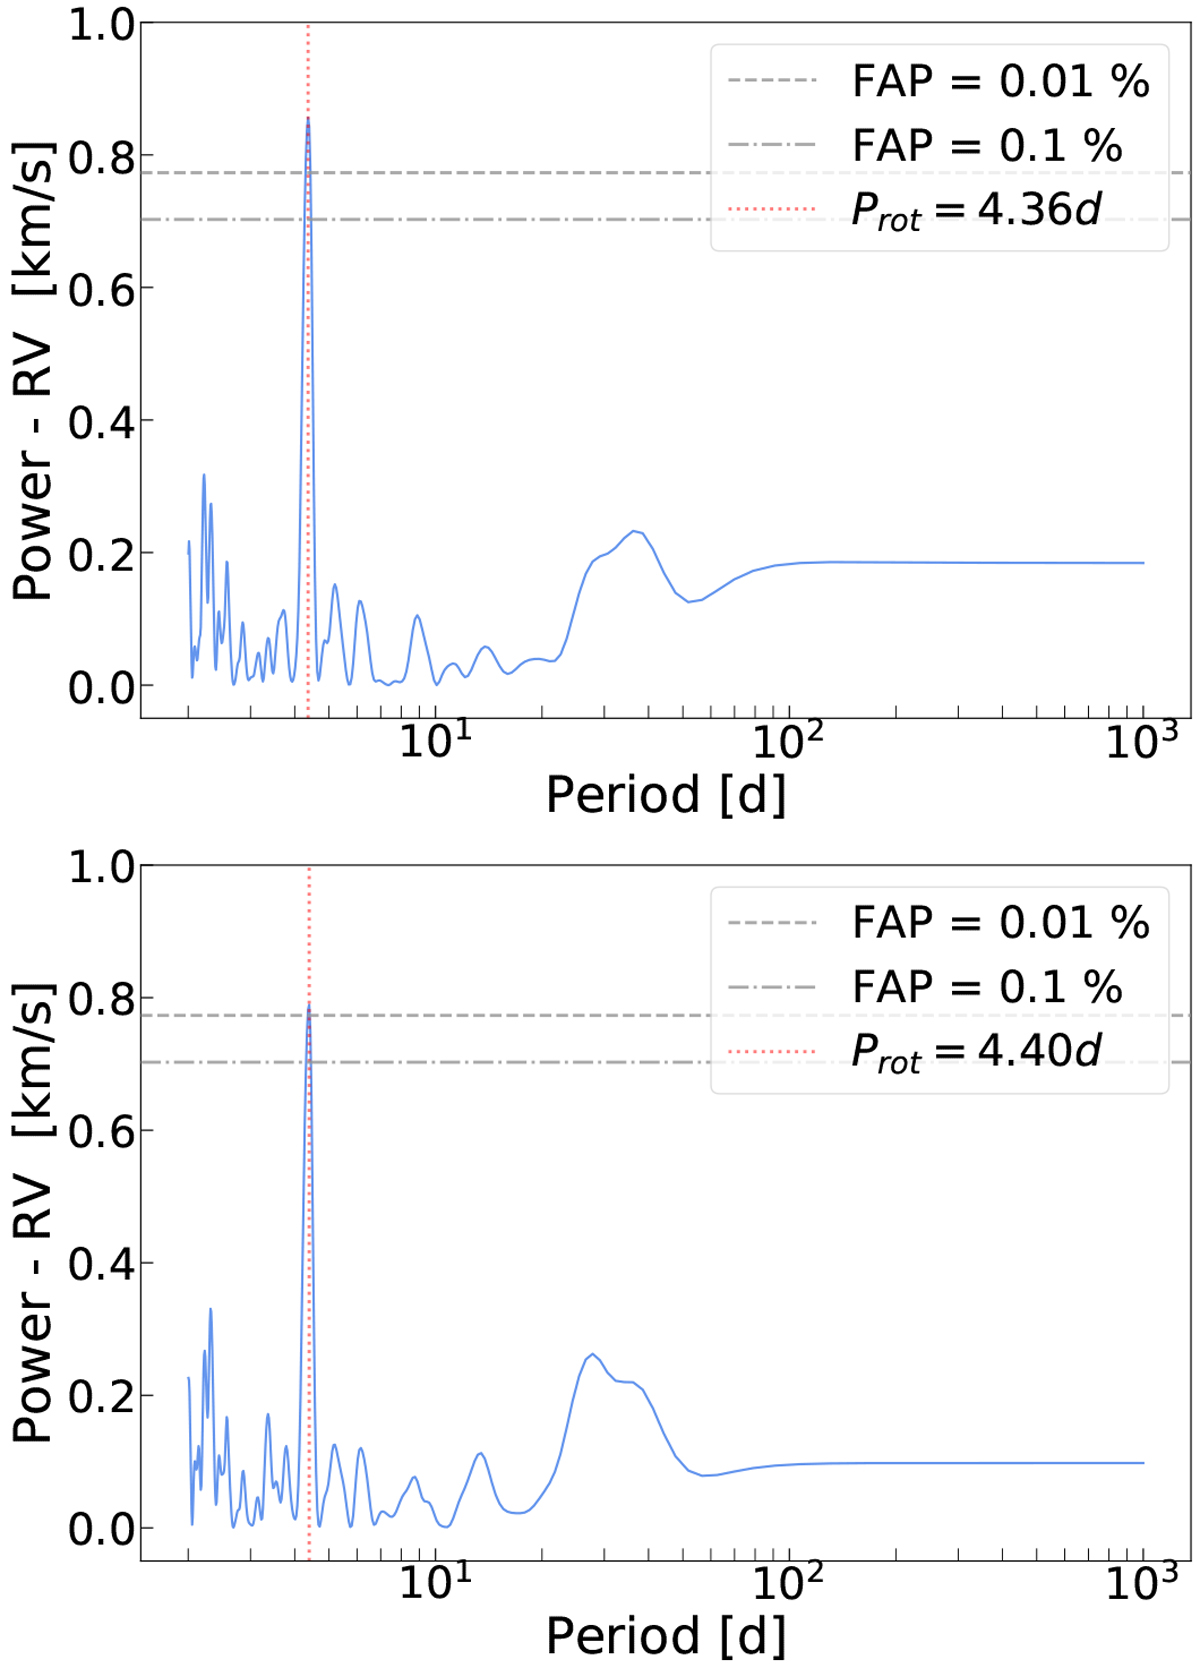
Fig. 7
Download original image
Comparison of the GLS periodograms when using two different masks. Top: GLS periodogram of the EV Lac 2010 RV data set obtained with the full mask. Bottom: same, but using the 2010-trained best sub-mask. The significance of the peak at the stellar rotation period decreases in the latter case, confirming the mitigating benefit of using the sub-mask derived from the randomised selection. There is a peak at30 d showing an increase in power when the best sub-mask is applied. A period analysis of the window function (VanderPlas 2018) reveals that the peak is most likely due to the observing span (~2 months) and cadence of the 2010 data set.
Current usage metrics show cumulative count of Article Views (full-text article views including HTML views, PDF and ePub downloads, according to the available data) and Abstracts Views on Vision4Press platform.
Data correspond to usage on the plateform after 2015. The current usage metrics is available 48-96 hours after online publication and is updated daily on week days.
Initial download of the metrics may take a while.