Open Access
Fig. 6
Download original image
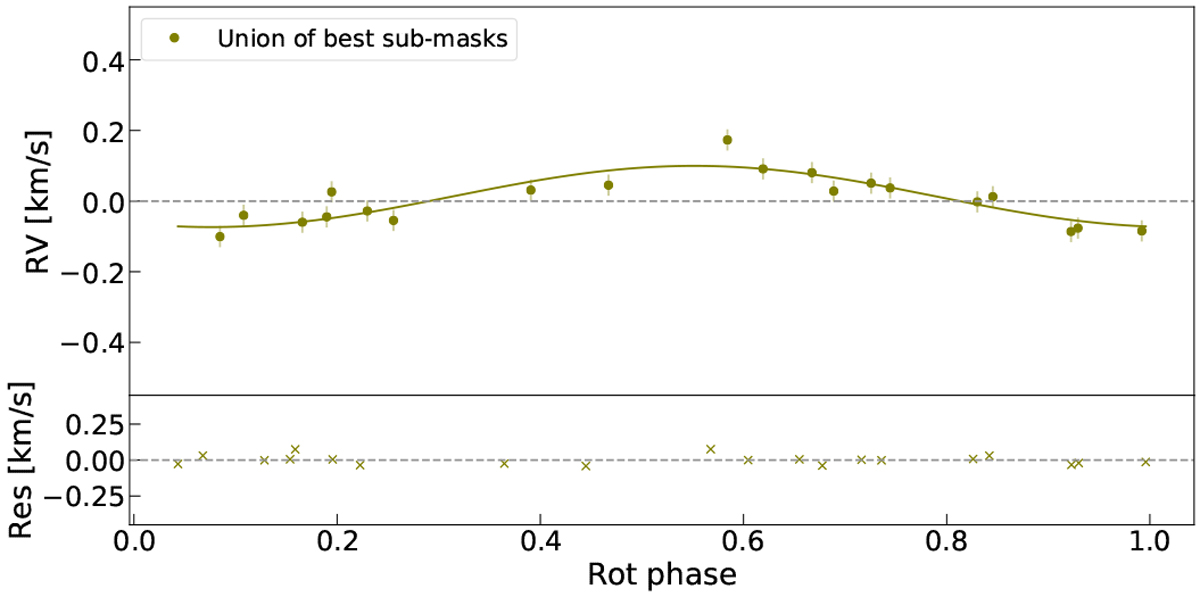
Phase-folded plot of the RV time series computed with the union of two best sub-masks (721 lines). The RV RMS of the data set is reduced by 63%, and the RV semi-amplitude by 51% relative to the full mask case. The decreased residual scatter around the fit should be noted.
Current usage metrics show cumulative count of Article Views (full-text article views including HTML views, PDF and ePub downloads, according to the available data) and Abstracts Views on Vision4Press platform.
Data correspond to usage on the plateform after 2015. The current usage metrics is available 48-96 hours after online publication and is updated daily on week days.
Initial download of the metrics may take a while.