Fig. 4
Download original image
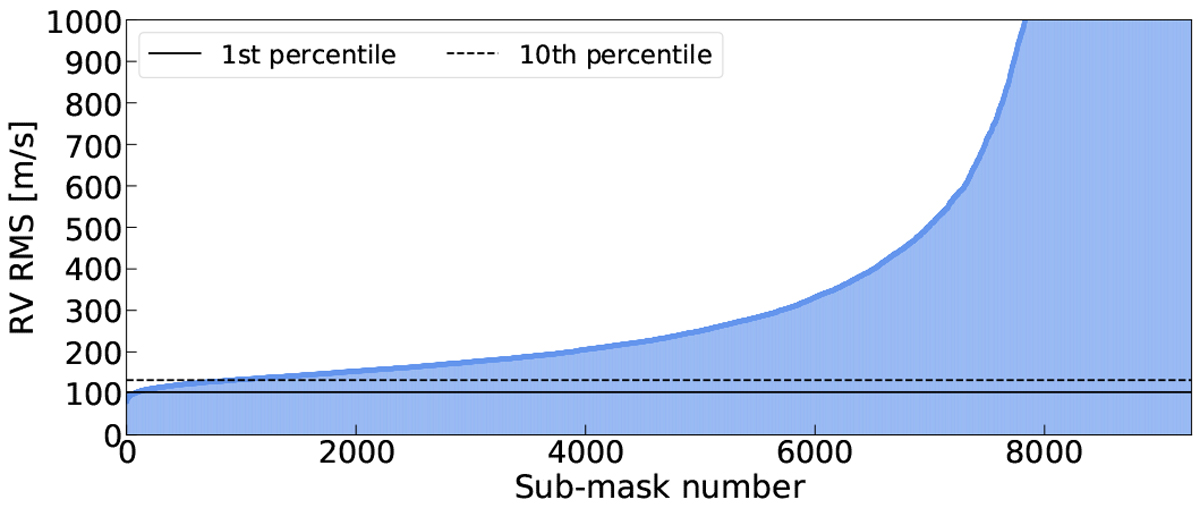
Distribution of the RV RMS associated with 9281 sub-masks of an example run with nsample = 50 and nstop = 100. Each RMS value is obtained after a 3σ clipping of the RV data set, which prevents outliers from contaminating the distinction between stable and unstable sub-masks. The RMS values are sorted in ascending order and truncated at 1 km s−1 for visualisation purposes (the maximum can reach up to 100 km s−1). Shown are the 1st (black solid line) and 10th (dashed black line) percentiles of the distribution.
Current usage metrics show cumulative count of Article Views (full-text article views including HTML views, PDF and ePub downloads, according to the available data) and Abstracts Views on Vision4Press platform.
Data correspond to usage on the plateform after 2015. The current usage metrics is available 48-96 hours after online publication and is updated daily on week days.
Initial download of the metrics may take a while.