Fig. 3
Download original image
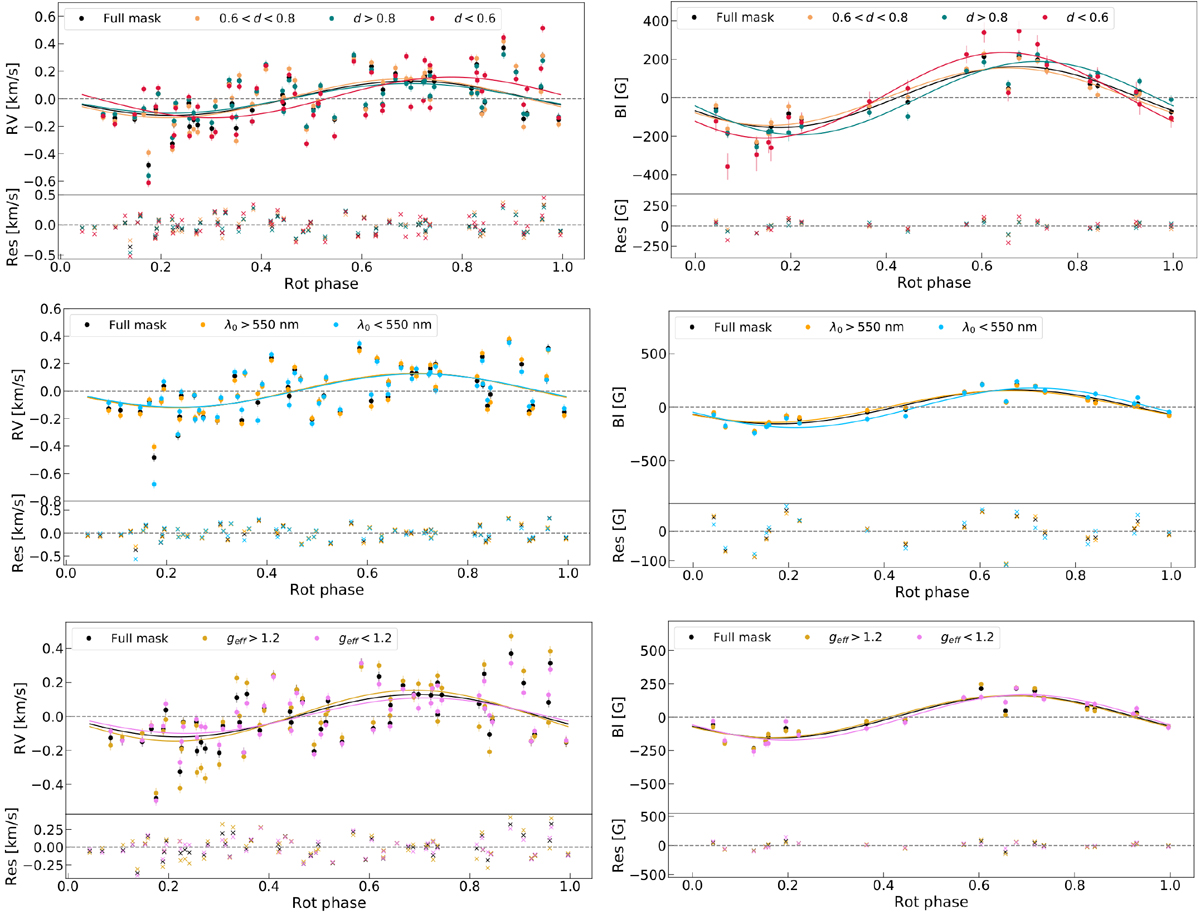
Comparison of RV and Bl data sets obtained with a parametric selection of sub-masks. Top: RV (left) and Bl (right) data sets obtained with a depth selection. Middle: same, but with a wavelength selection. Bottom: same, but with a Landé factor selection. In all panels the black data points correspond to either the RV or the Bl values obtained with the full mask, whereas the continuous lines represent the sinusoidal fit of the associated data set. The mean of the data set is subtracted to allow a simpler comparison. For RV estimates, the error bars are set to 30 m s−1, as derived from the telluric line-based wavelength calibration of the spectra (Moutou et al. 2007), which is greater than the photon noise for each of these data sets. For Bl the formal uncertainties are used. The displayed data sets are 3σ clipped to prevent outliers from affecting the results. For Bl the densest epoch (2010) is displayed.
Current usage metrics show cumulative count of Article Views (full-text article views including HTML views, PDF and ePub downloads, according to the available data) and Abstracts Views on Vision4Press platform.
Data correspond to usage on the plateform after 2015. The current usage metrics is available 48-96 hours after online publication and is updated daily on week days.
Initial download of the metrics may take a while.