Fig. A.1
Download original image
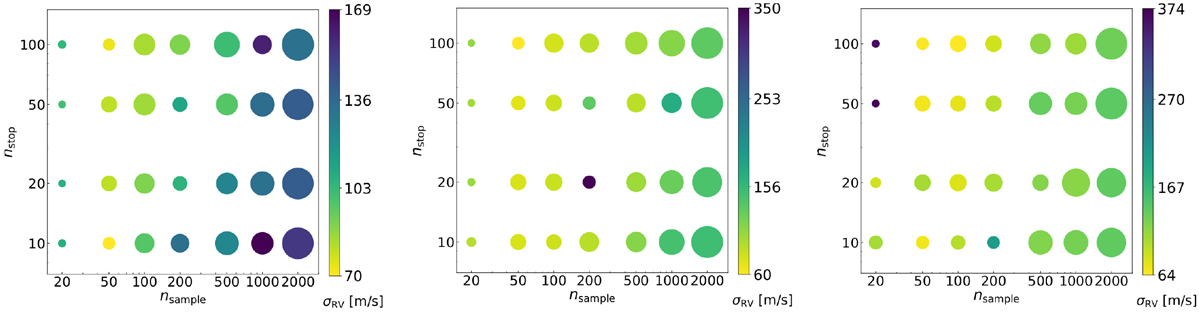
Optimisation of the randomised algorithm control variables. The simulation grid for each (nsample, nstop) combination is shown, with data points coded by colour and size according to the RV RMS and number of lines within the sub-mask, respectively. The optimised (nsample, nstop) pair is (50, 100), ensuring both a precise RV data set and a dense exploration of the sub-mask space. The panels from left to right illustrate the 10th, 5th, and 1st percentile case.
Current usage metrics show cumulative count of Article Views (full-text article views including HTML views, PDF and ePub downloads, according to the available data) and Abstracts Views on Vision4Press platform.
Data correspond to usage on the plateform after 2015. The current usage metrics is available 48-96 hours after online publication and is updated daily on week days.
Initial download of the metrics may take a while.