Free Access
Fig. 1.
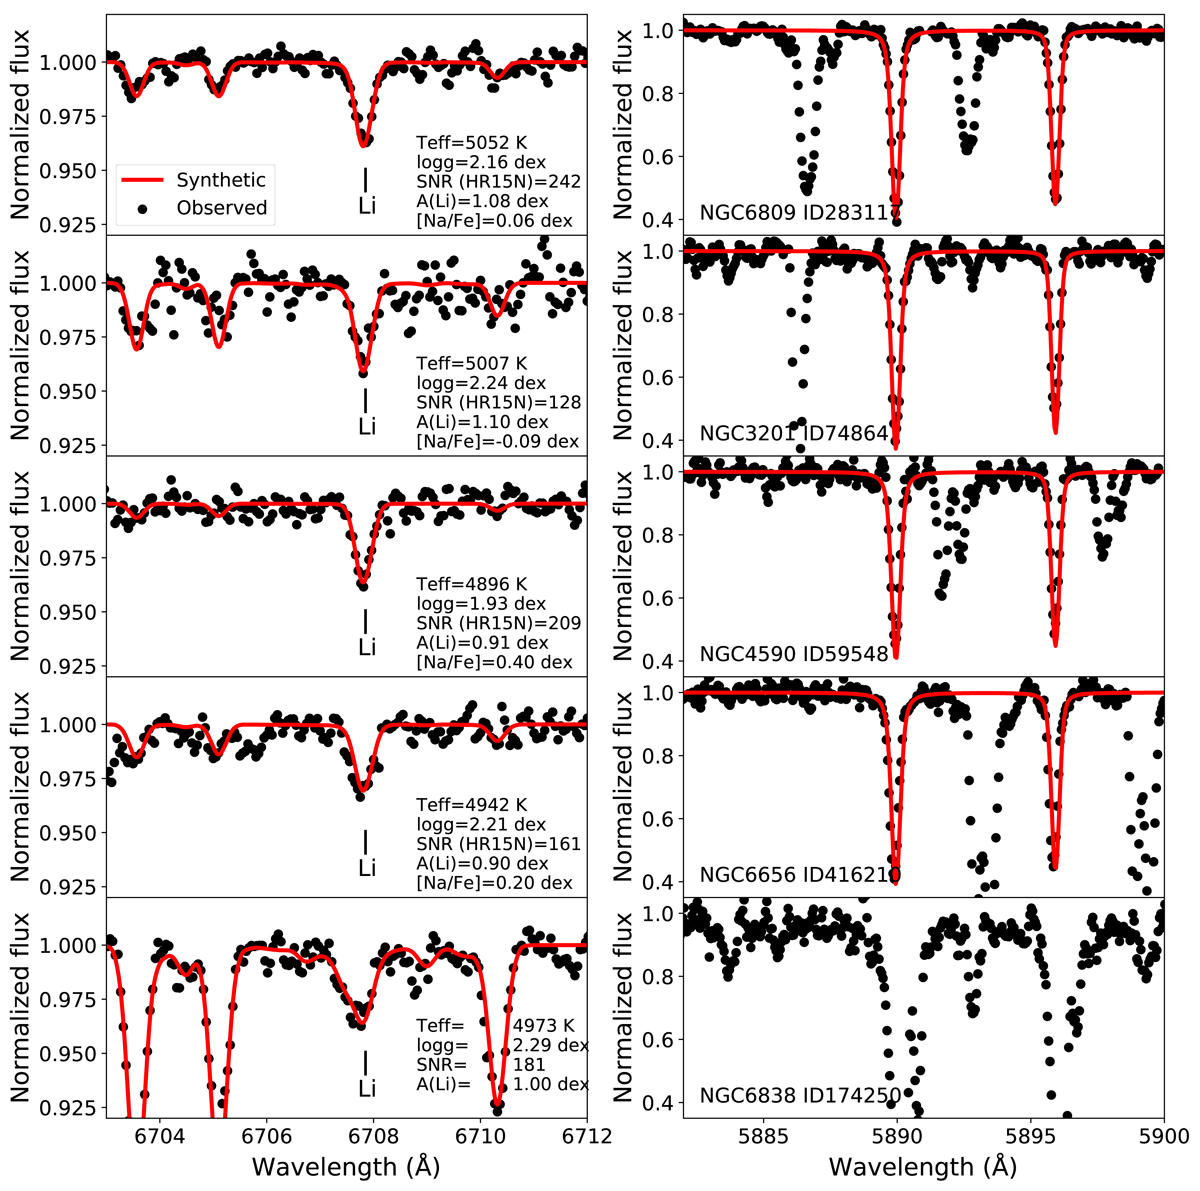
Download original image
Spectra from one typical sample star in each of the clusters in the region of the Li line (left) and the Na doublet (right), and the respective synthetic fits to the lines to measure the abundances. Stellar parameters, NLTE abundances, and S/N of the spectra are indicated for each star.
Current usage metrics show cumulative count of Article Views (full-text article views including HTML views, PDF and ePub downloads, according to the available data) and Abstracts Views on Vision4Press platform.
Data correspond to usage on the plateform after 2015. The current usage metrics is available 48-96 hours after online publication and is updated daily on week days.
Initial download of the metrics may take a while.