Fig. 7
Download original image
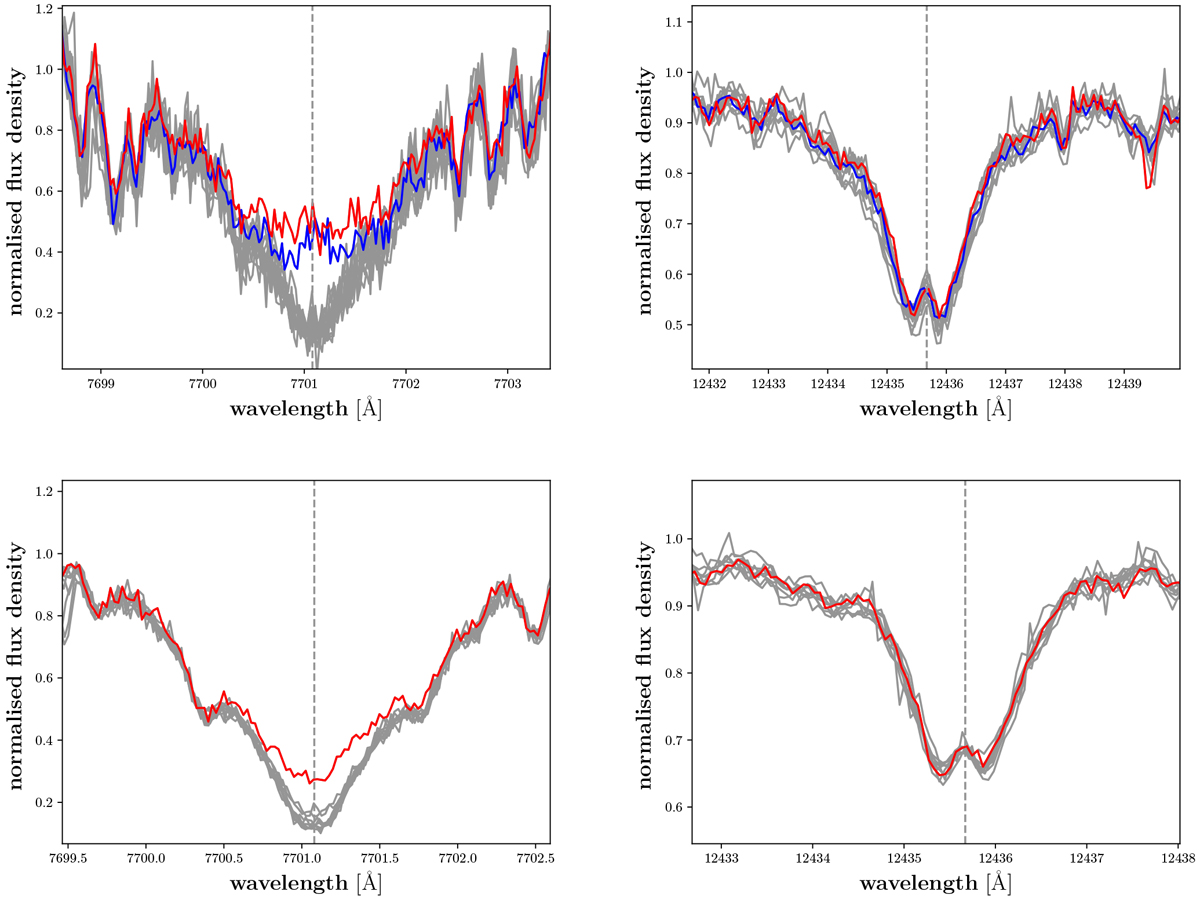
K I VISred (left) and K I IRblue (right) spectra of 1RXS J114728.8+664405 (top) and EV Lac (bottom) during quiescence (grey lines) and flares (red and blue lines). In contrast to the K I VISred line, the K I IRblue line does not appear to react to flares. The double dip structure of the K I IRblue line is explained in Sect. 3.3.3.
Current usage metrics show cumulative count of Article Views (full-text article views including HTML views, PDF and ePub downloads, according to the available data) and Abstracts Views on Vision4Press platform.
Data correspond to usage on the plateform after 2015. The current usage metrics is available 48-96 hours after online publication and is updated daily on week days.
Initial download of the metrics may take a while.