Free Access
Fig. B.2
Download original image
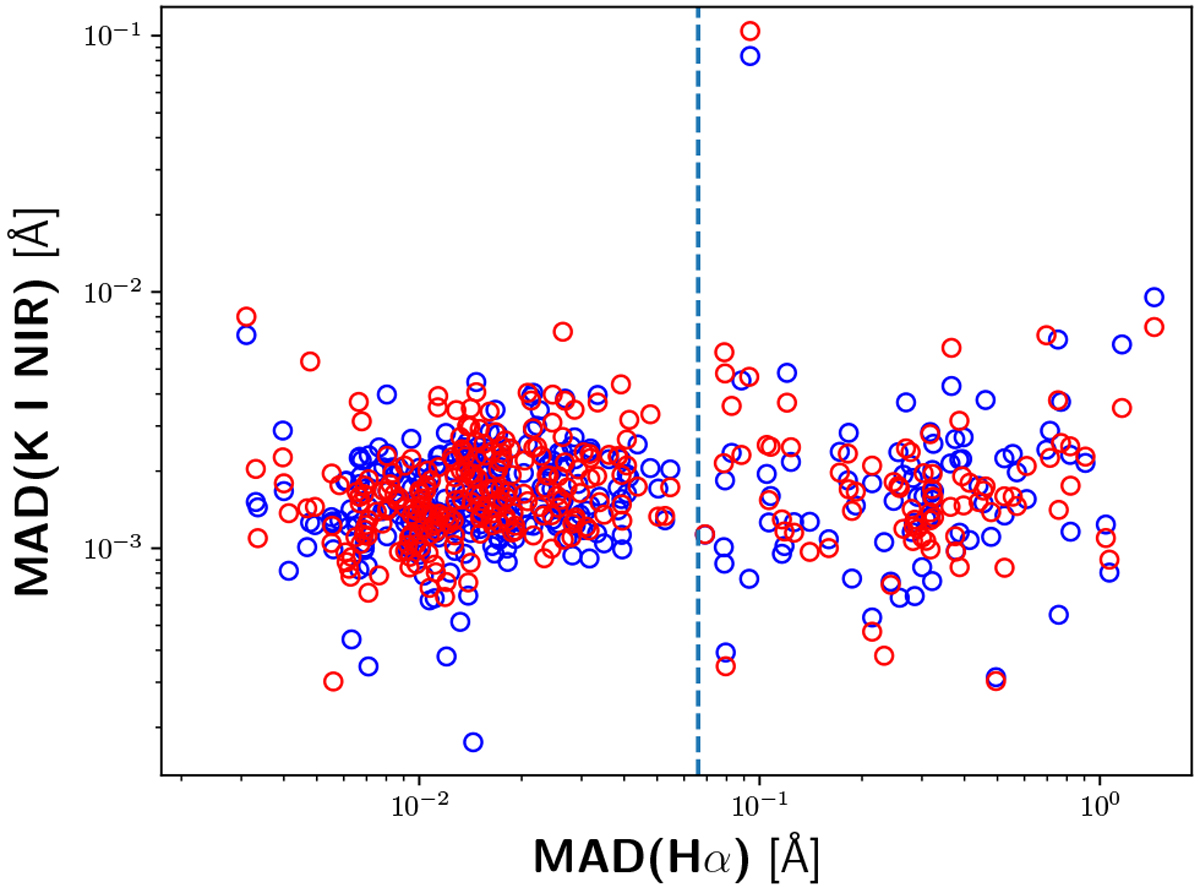
Same as Fig. 2, but for the K I IRred (red circles) and the K I IRblue (blue circles) line.The two outliers at the top are caused by the same star, which has only four measurements, out of which two happen to be compromised by low S/N, which leads to the large MAD(K I IR) values.
Current usage metrics show cumulative count of Article Views (full-text article views including HTML views, PDF and ePub downloads, according to the available data) and Abstracts Views on Vision4Press platform.
Data correspond to usage on the plateform after 2015. The current usage metrics is available 48-96 hours after online publication and is updated daily on week days.
Initial download of the metrics may take a while.