Fig. 5
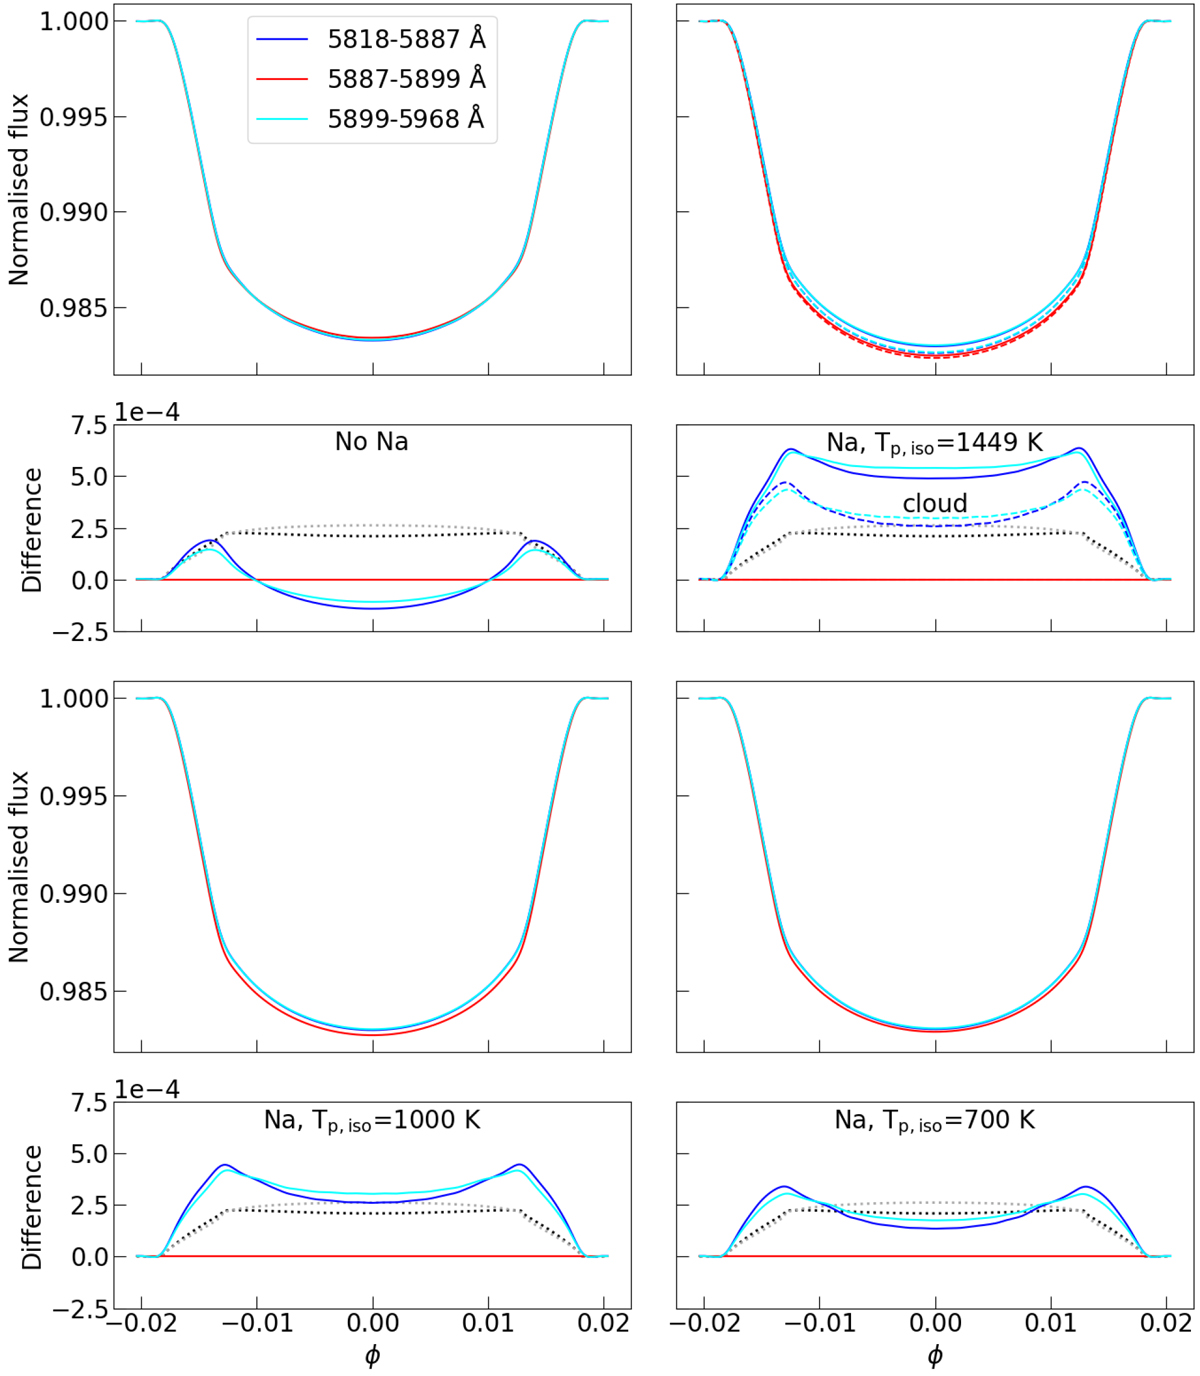
Download original image
Simulated transit light curves of HD 209458 b for the same three passbands adopted in the HST data analysis and five planetary atmosphere models. The blue, red, and bright blue lines are obtained as described in Sect. 3, with the continuous and dashed lines corresponding to clear and cloudy models, respectively. The bottom panels show the transit model differences with respect to that of the central band. The black and grey dotted lines are the HST model differences from Fig. 1. We note that the HST model differences have a more trapezoidal shape than those obtained from the other set of simulations, because of the different limb-darkening profiles of the underlying STAGGER and MARCS stellar models.
Current usage metrics show cumulative count of Article Views (full-text article views including HTML views, PDF and ePub downloads, according to the available data) and Abstracts Views on Vision4Press platform.
Data correspond to usage on the plateform after 2015. The current usage metrics is available 48-96 hours after online publication and is updated daily on week days.
Initial download of the metrics may take a while.