Fig. 1
Download original image
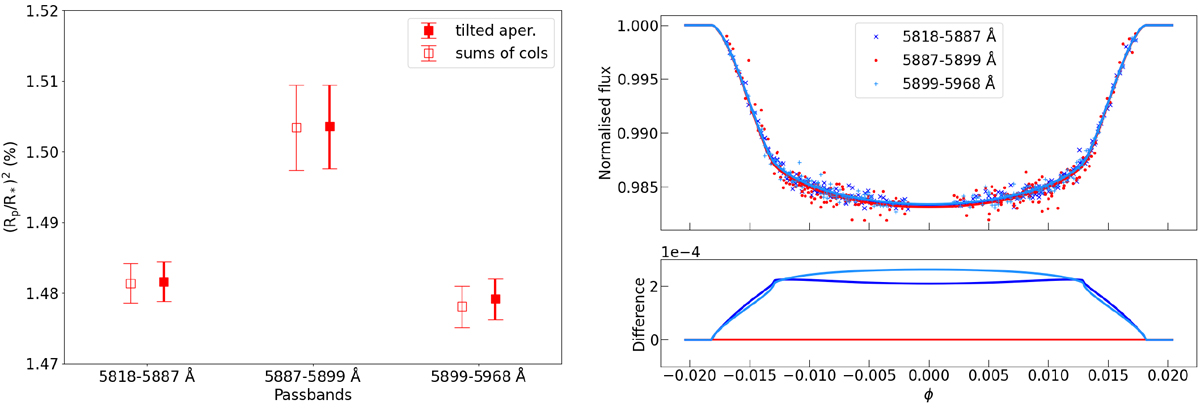
Left: best-fit transit depths to HST data around the Na I lines, as reported in Table 3. Right: divide-oot detrended and phase-folded HST light curves (see Sect. 2.2.2) for the 5818–5887 Å (blue crosses), 5887–5899 Å (red dots), and 5899–5968 Å (dodger blue pluses) passbands, along with best-fit transit models (continuous coloured lines). The detrended out-of-transit data are not represented, as they are identical to 1 by definition of the divide-oot method (Berta et al. 2012). Bottom panel: transit model differences with respect to that of the central band. The slightly different shape between the two side bands is due to differential limb darkening.
Current usage metrics show cumulative count of Article Views (full-text article views including HTML views, PDF and ePub downloads, according to the available data) and Abstracts Views on Vision4Press platform.
Data correspond to usage on the plateform after 2015. The current usage metrics is available 48-96 hours after online publication and is updated daily on week days.
Initial download of the metrics may take a while.