Fig. 8
Download original image
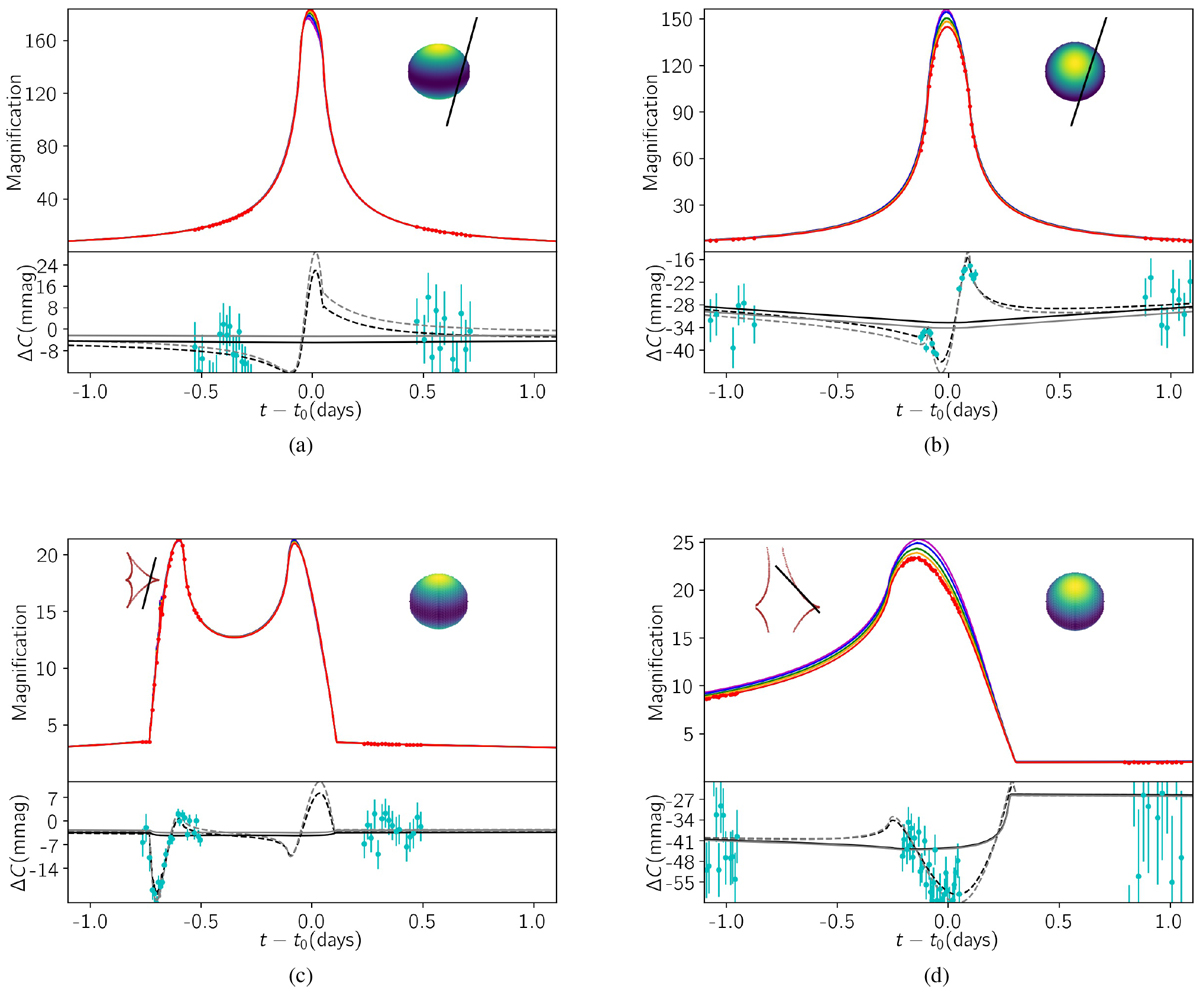
Similar to Figs. 5–7, but for early-type source stars by considering the GD and BL effects. The parameters of the light curves are given in Table 6. The right-hand insets (colored schemes) represent brightness profiles over gravity-darkened source disks and the projected lens trajectory (black lines). In the residual parts, the perturbations in stellar colors due to the GD and BL effects are shown by dashed curves. The corresponding BL-induced chromatic perturbations are represented by solid curves.
Current usage metrics show cumulative count of Article Views (full-text article views including HTML views, PDF and ePub downloads, according to the available data) and Abstracts Views on Vision4Press platform.
Data correspond to usage on the plateform after 2015. The current usage metrics is available 48-96 hours after online publication and is updated daily on week days.
Initial download of the metrics may take a while.