Fig. 7
Download original image
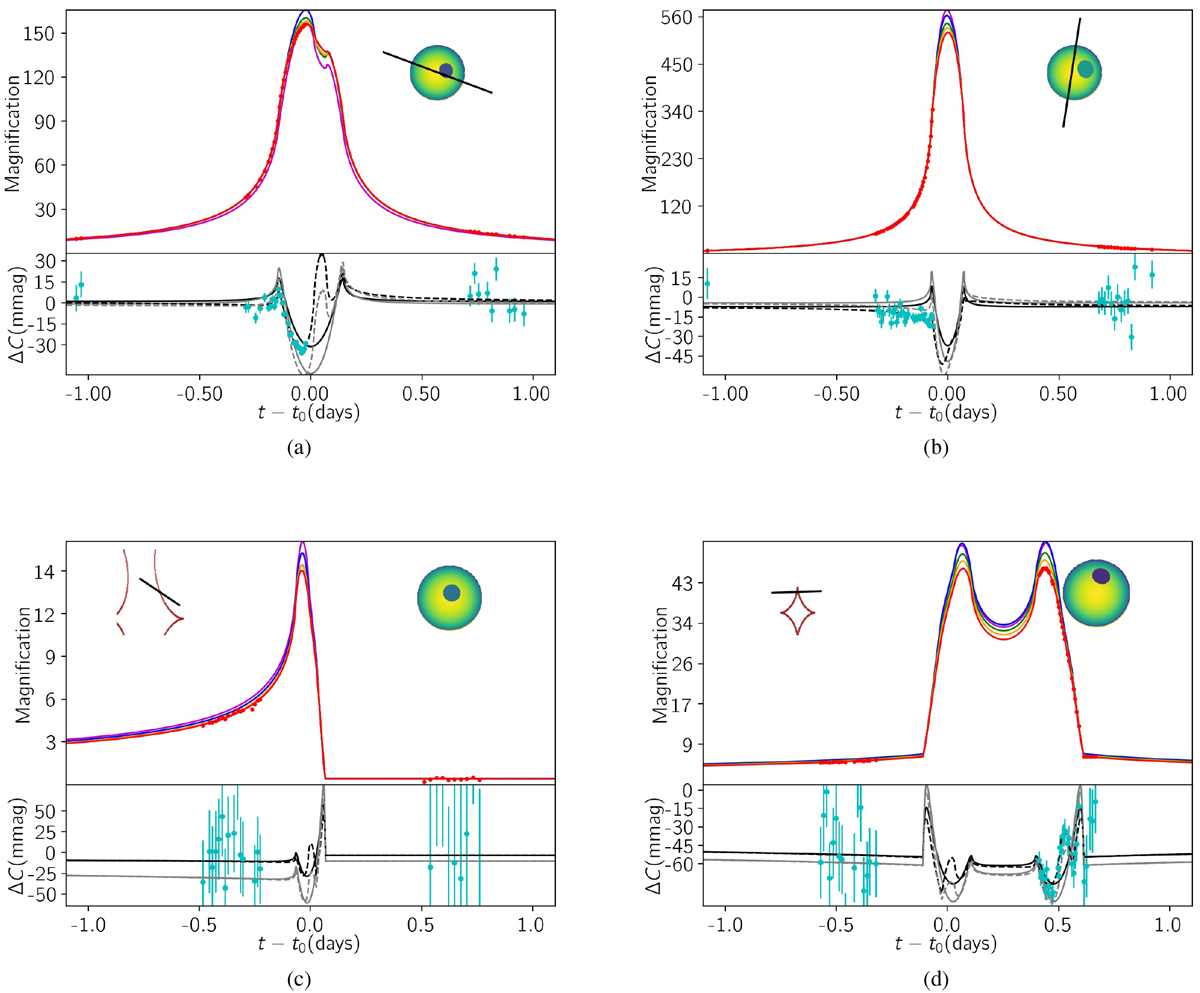
HM and CC microlensing light curves of limb-darkened, blended, and spotted source stars are plotted in a similar way as in Figs. 5 and 6. In these plots, the brightness profiles over the source disks (by considering LD and stellar spots) and the lens trajectory (solid black lines) are shown in the right-hand inside parts. The chromatic perturbations in the V -I and B-R stellar colors by considering only LD, BL effects (solid) and LD, BL as well as stellar spots (dashed) are shown in the residual parts with black and gray curves. The parameters of the light curves are reported in Table 5.
Current usage metrics show cumulative count of Article Views (full-text article views including HTML views, PDF and ePub downloads, according to the available data) and Abstracts Views on Vision4Press platform.
Data correspond to usage on the plateform after 2015. The current usage metrics is available 48-96 hours after online publication and is updated daily on week days.
Initial download of the metrics may take a while.