Fig. 6
Download original image
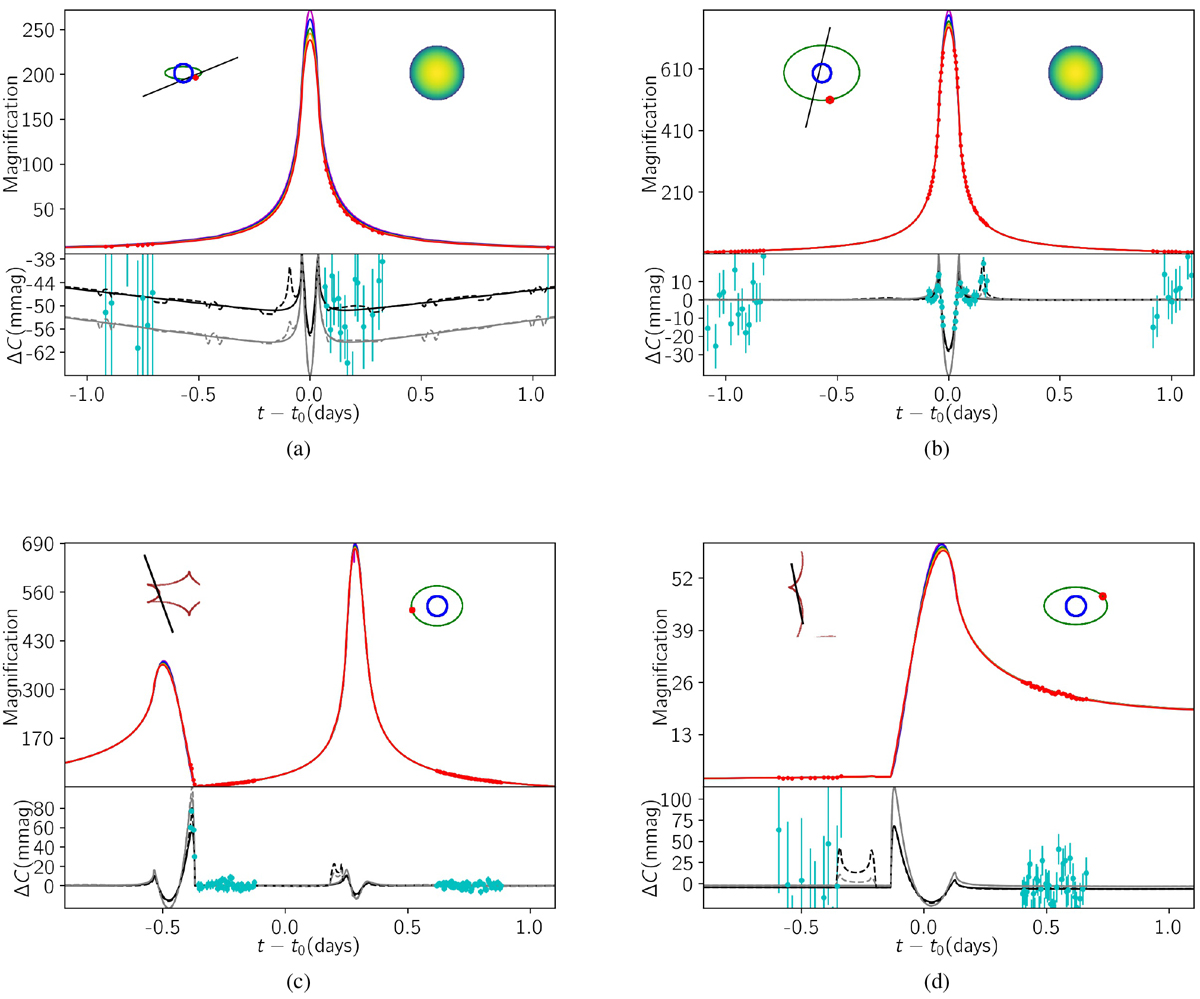
HM and CC microlensing light curves of limb-darkened and blended source stars are plotted, but we additionally consider a close-in giant planet around each source star. Details are similar to those in Fig. 5. In each panel, the source star (blue circle), its planet (red circle), the planet orbit projected on the sky plane (green curve), and the lens trajectory (black solid line) are shown as insets in the figures. The chromatic perturbations in the V -I and B-R stellar colors by considering only the LD and BL effects (solid) and LD, BL plus a source star planet (dashed) are shown in the residual parts with black and gray curves. Their parameters are given in Table 4.
Current usage metrics show cumulative count of Article Views (full-text article views including HTML views, PDF and ePub downloads, according to the available data) and Abstracts Views on Vision4Press platform.
Data correspond to usage on the plateform after 2015. The current usage metrics is available 48-96 hours after online publication and is updated daily on week days.
Initial download of the metrics may take a while.