Fig. 5
Download original image
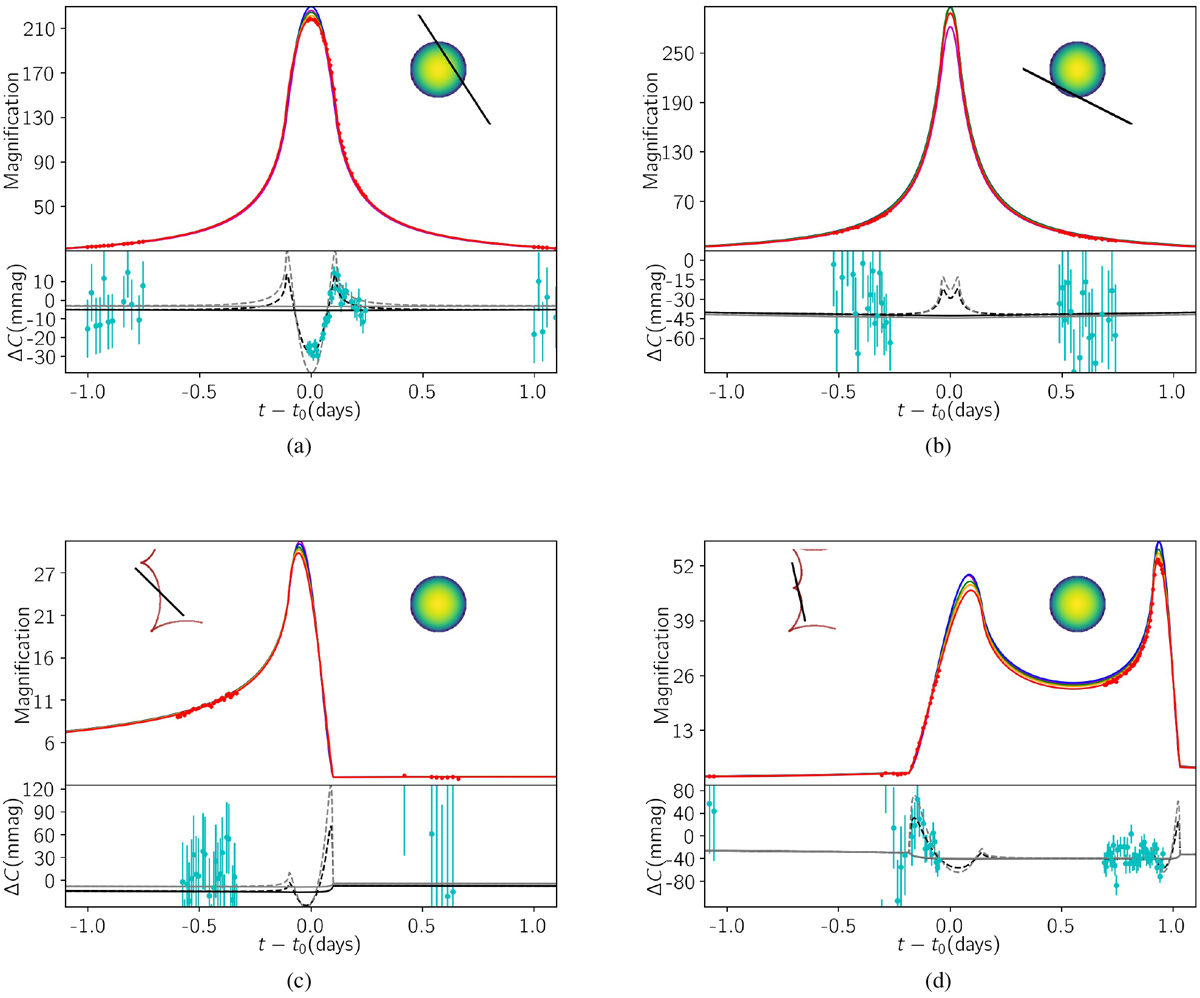
HM and CC microlensing light curves of limb-darkened and blended source stars are plotted. Details are similar to those in Fig. 2. The lensing parameters are listed in Table 3. In the residual parts, the perturbations in stellar colors V -I and B-R during the lensing effect due to LD and BL effects are shown by dashed (black and gray) curves, respectively. The corresponding chromatic BL-induced perturbations are shown by solid curves. The right-hand insets (colored schemes) represent brightness profiles over limb-darkened source disks.
Current usage metrics show cumulative count of Article Views (full-text article views including HTML views, PDF and ePub downloads, according to the available data) and Abstracts Views on Vision4Press platform.
Data correspond to usage on the plateform after 2015. The current usage metrics is available 48-96 hours after online publication and is updated daily on week days.
Initial download of the metrics may take a while.