Fig. 2
Download original image
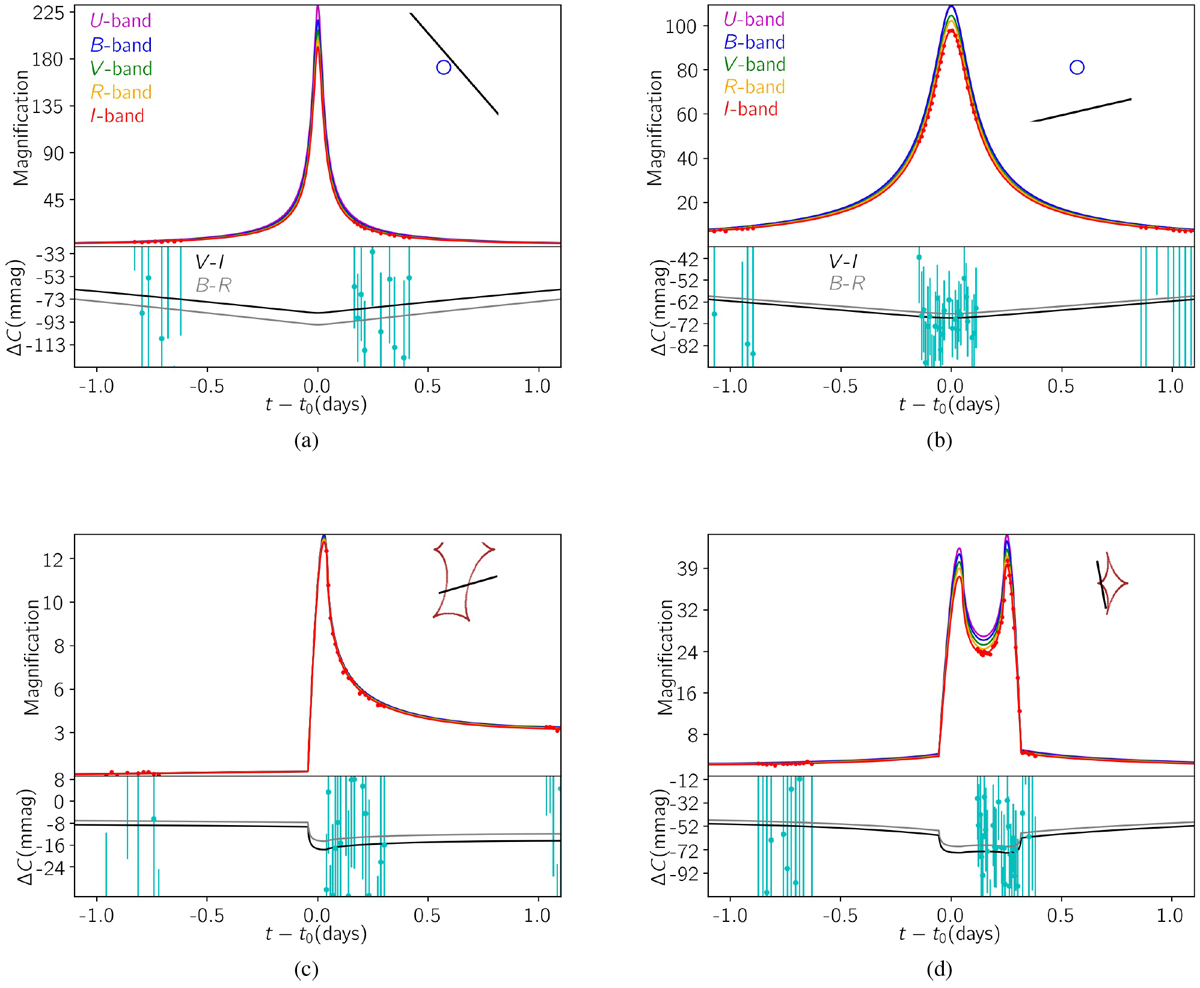
HM and CC microlensing light curves of blended source stars in the passband filters UBV RI, are shown by magenta, blue, green, orange, and red colors, respectively. The perturbations in stellar colors V -I and B-R during the lensing effect are shown in the residual parts by solid (black and gray) curves, respectively. The source star parameters are listed in Table 1. The synthetic data points by the LI camera at the Danish telescope in the I-band are shownwith red filled circles. The corresponding data points over the residual parts (related to the V -I color) are plotted by cyan filled points. In the two top panels, each right-hand inset shows the source star (blue circle) and the lenstrajectory (black line) both projected on the lens plane. In the bottom panels, each right-hand inset shows the caustic curve (brown curve) and the source trajectory (black line) projected onto the lens plane.
Current usage metrics show cumulative count of Article Views (full-text article views including HTML views, PDF and ePub downloads, according to the available data) and Abstracts Views on Vision4Press platform.
Data correspond to usage on the plateform after 2015. The current usage metrics is available 48-96 hours after online publication and is updated daily on week days.
Initial download of the metrics may take a while.