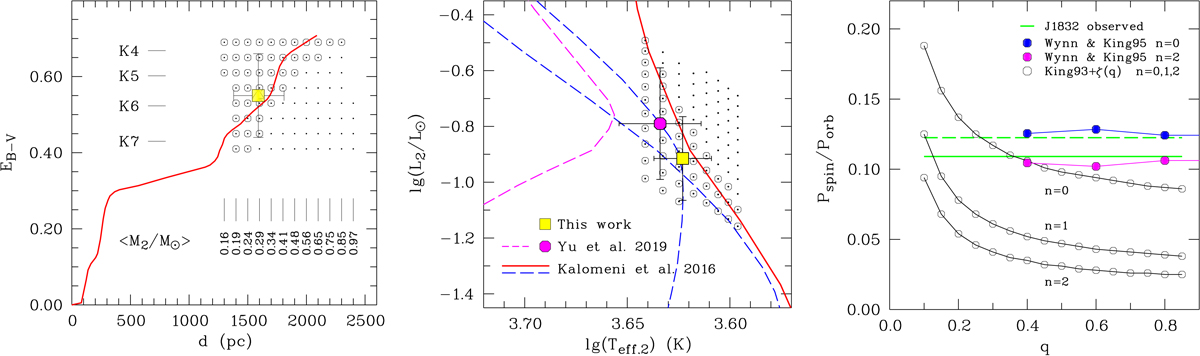
Fig. 9.
Download original image
Left: confidence range for models of the secondary star permitted by the photometric SED in the eclipse of J1832 (dots and encircled dots). All models have distances within the error bounds of Gaia EDR3 (footnote 3). The red curve represents the best estimate of the extinction along the line of sight to J1832 (Lallement et al. 2018). Center: position of the secondary star of J1832 in its HR diagram. The dots indicate all photometrically accepted models. The encircled dots denote here and in the left panel the subsample with luminosity L2 not exceeding the limit set by the BPS of Kalomeni et al. (2016) (red curve). No model should be found above and to the right of the red curve (see text). The yellow-filled square in both panels marks the mean position of this subsample. The dashed blue curves from Kalomeni et al. (2016) indicate two evolutionary tracks along which J1832 may evolve. Also shown are the position of the 9 h binary KIC 5608384 of Yu et al. (2019) (magenta dot) and its suggested evolutionary track that leads to the graveyard of ultracompact binaries (magenta dashed curve). Right: period ratio Pspin/Porb vs. mass ratio q. The horizontal green lines indicate the observed period ratio of J1832. The open and filled circles denote the theoretical period ratios from the analytical theory of K93 and the numerical calculations of WK95.
Current usage metrics show cumulative count of Article Views (full-text article views including HTML views, PDF and ePub downloads, according to the available data) and Abstracts Views on Vision4Press platform.
Data correspond to usage on the plateform after 2015. The current usage metrics is available 48-96 hours after online publication and is updated daily on week days.
Initial download of the metrics may take a while.