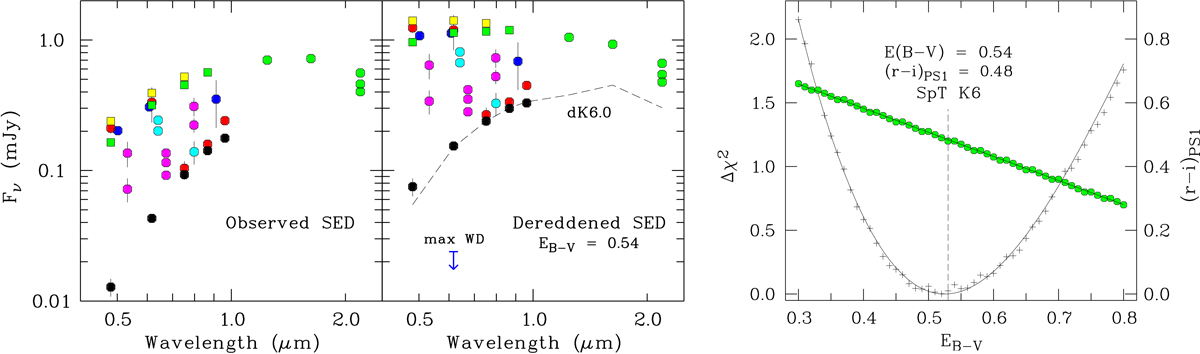
Fig. 8.
Download original image
Left: observed SED of J1832. Black dots refer to the minimum fluxes in the eclipse and represent our best estimate of the SED of the secondary star. Green and yellow squares indicate the SED outside eclipse measured simultaneously with the MuSCAT3 photometer and the FTN on 9 May and 15 April 2021, respectively. Colored dots indicate nonsimultaneous out-of-eclipse fluxes (see text). Center: de-reddened SED based on the best-fit EB − V = 0.54. Right:Δχ2 vs. EB − V (plus signs, left scale) and the associated (r − i)P1 (green dots, right scale).
Current usage metrics show cumulative count of Article Views (full-text article views including HTML views, PDF and ePub downloads, according to the available data) and Abstracts Views on Vision4Press platform.
Data correspond to usage on the plateform after 2015. The current usage metrics is available 48-96 hours after online publication and is updated daily on week days.
Initial download of the metrics may take a while.