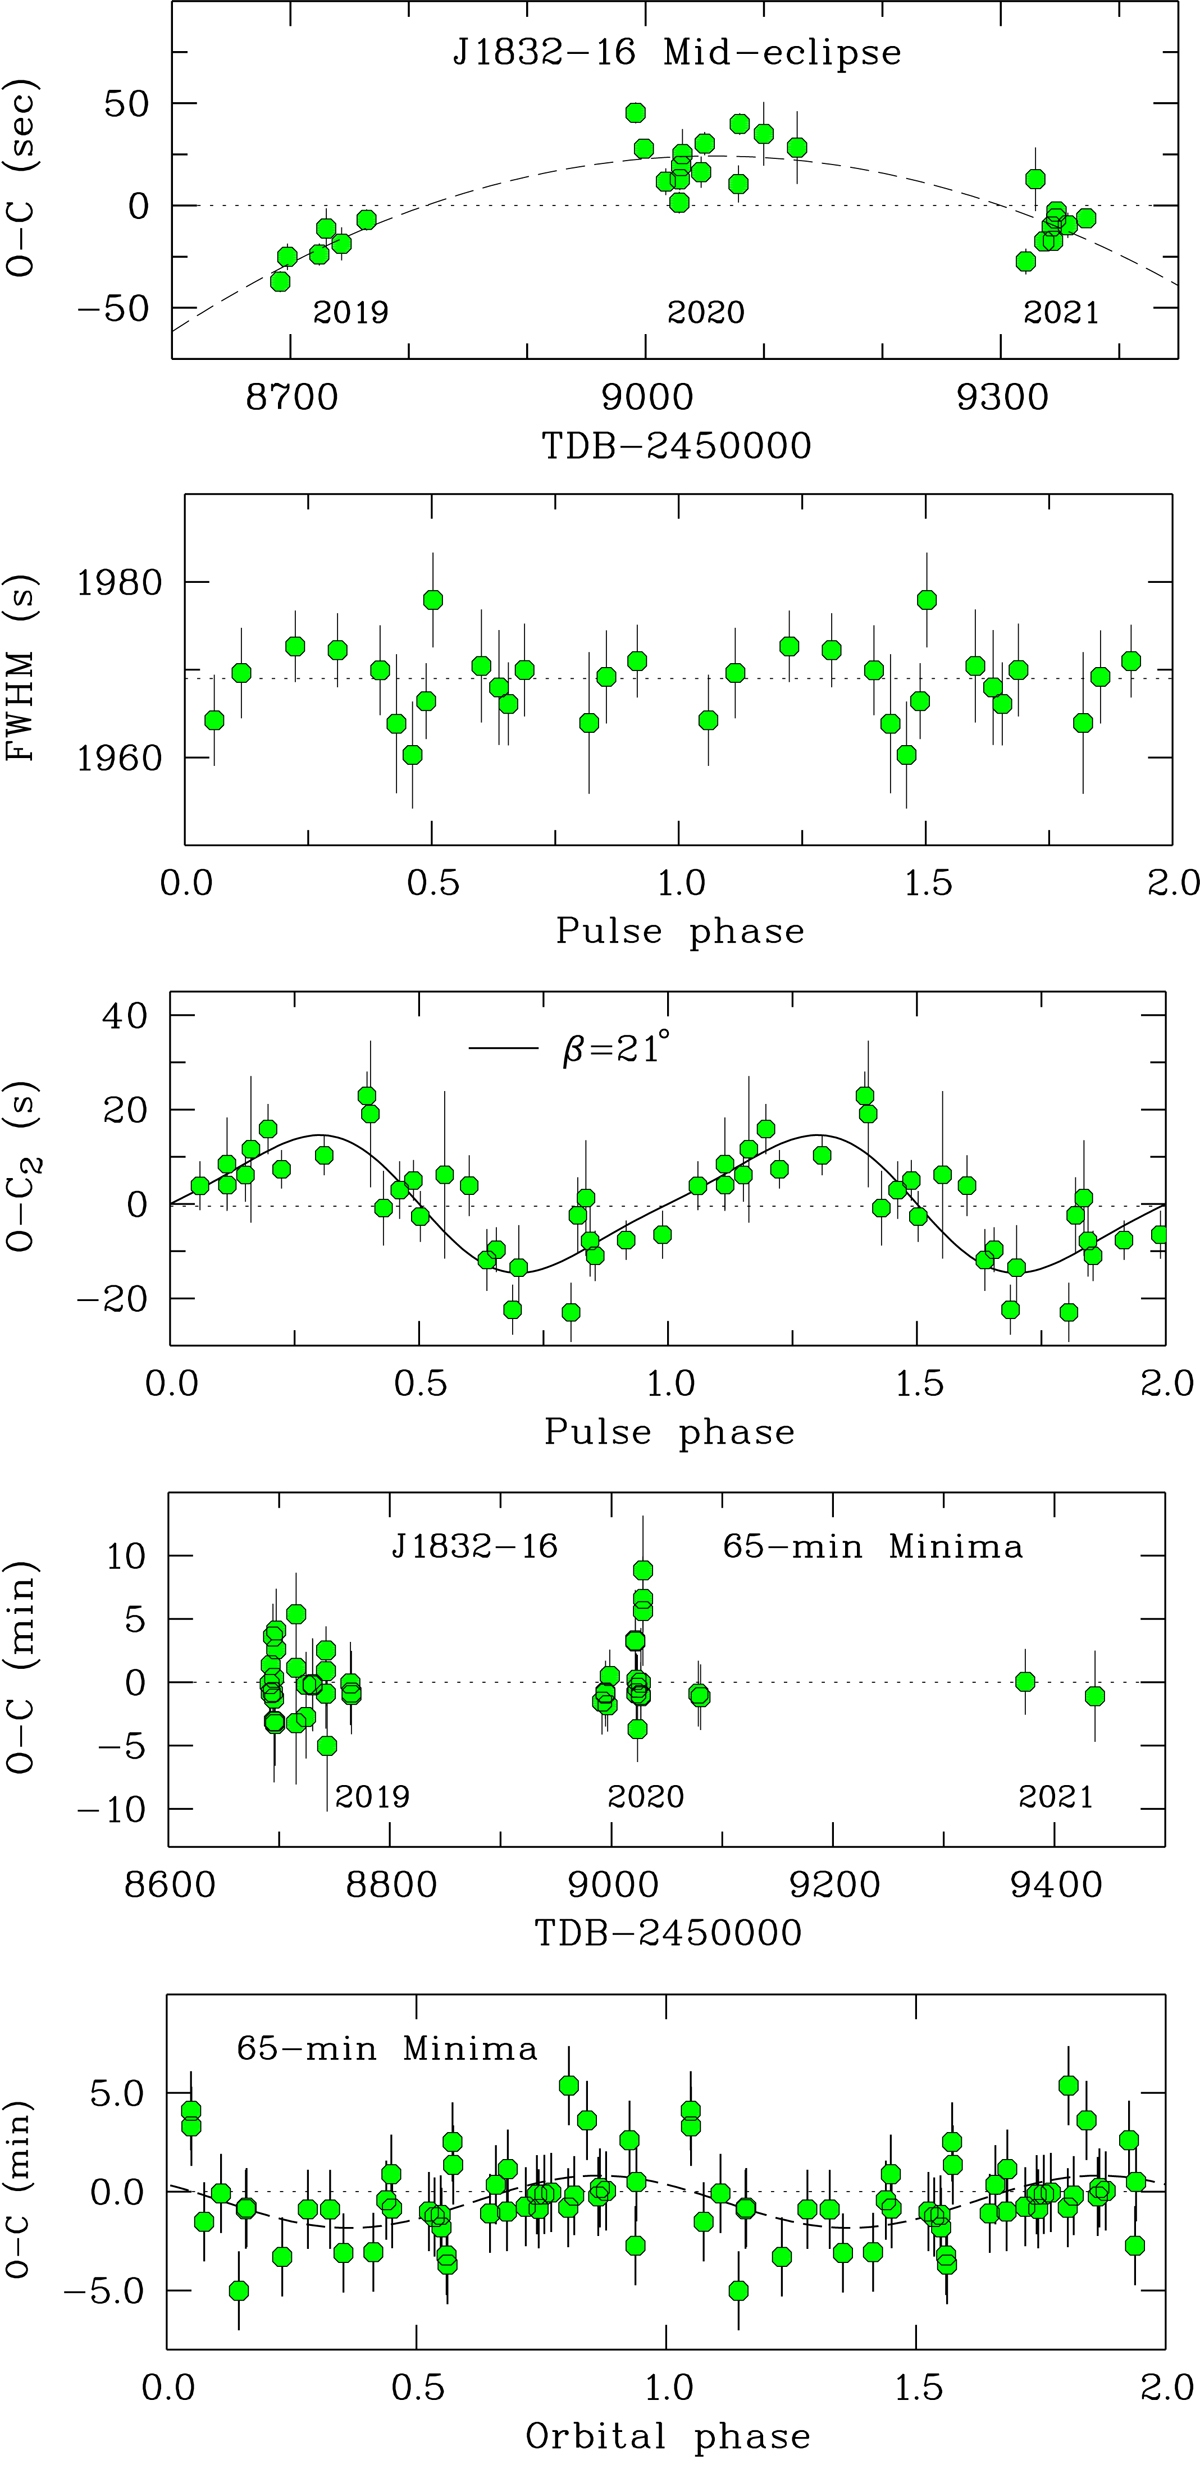
Fig. 5.
Download original image
Top: O–C diagram of the mid-eclipse times relative to the linear ephemeris of Eq. (1). The difference between the quadratic and linear ephemerides of Eqs. (2) and (1) is shown as the dashed curve. Second from top: FWHM of the eclipse vs. pulse phase from Eq. (6). Center: O–C values of the mid-eclipse times relative to the quadratic ephemeris vs. pulse phase. The model curve is from Eq. (4) (see text). Second from bottom: O–C diagram for the minimum times of the 65-minute pulsations relative to the linear ephemeris of Eq. (6). Bottom: O–C values of the previous graph vs. orbital phase (see text).
Current usage metrics show cumulative count of Article Views (full-text article views including HTML views, PDF and ePub downloads, according to the available data) and Abstracts Views on Vision4Press platform.
Data correspond to usage on the plateform after 2015. The current usage metrics is available 48-96 hours after online publication and is updated daily on week days.
Initial download of the metrics may take a while.