Fig. 3.
Download original image
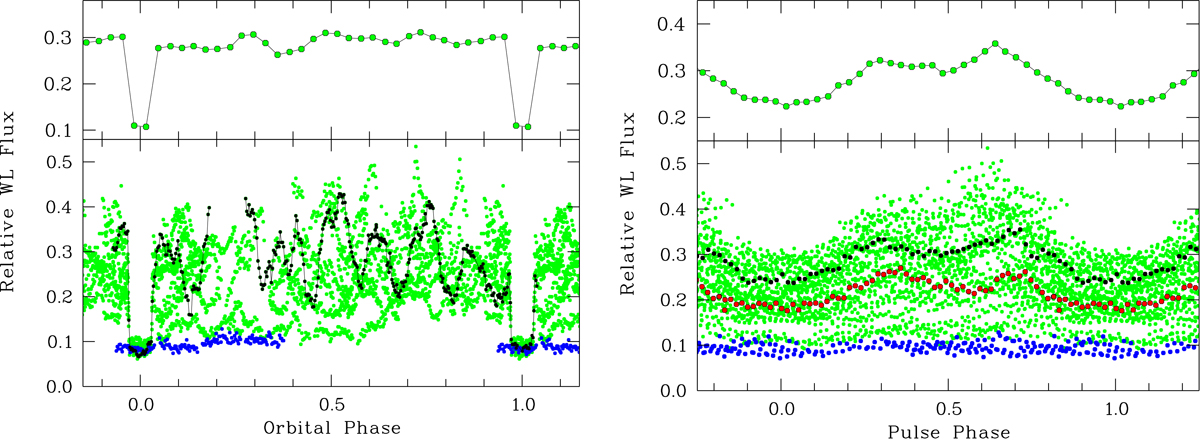
Bottom panels: light curves in WL folded on the orbital period of Eq. (1) (left) and on the pulse period of Eq. (6) (right). All individual relative WL fluxes are shown as green dots, and selected individual light curves are emphasized in black, red, and blue (see text). Top panels: mean light curves collected into 32 orbital bins (left) and pulse bins (right).
Current usage metrics show cumulative count of Article Views (full-text article views including HTML views, PDF and ePub downloads, according to the available data) and Abstracts Views on Vision4Press platform.
Data correspond to usage on the plateform after 2015. The current usage metrics is available 48-96 hours after online publication and is updated daily on week days.
Initial download of the metrics may take a while.