Free Access
Fig. 2.
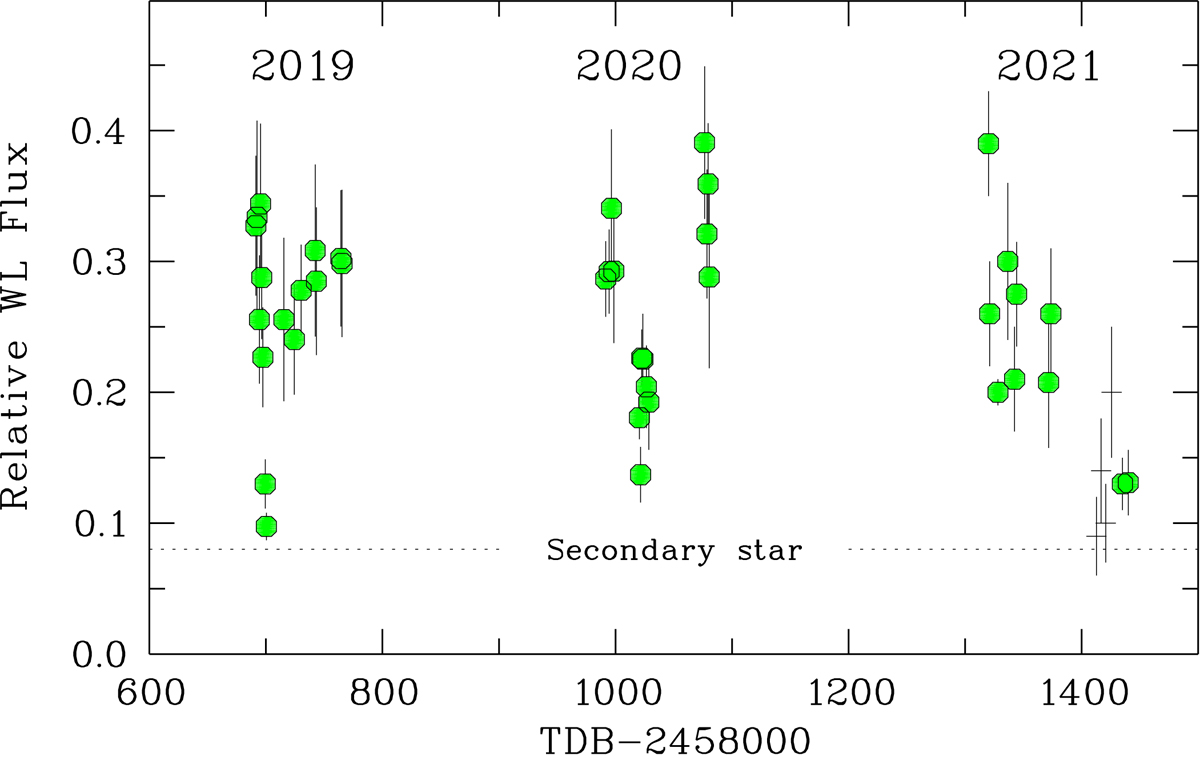
Download original image
Long-term light curve, showing nightly averages of the WL fluxes relative to comparison star C3 (green dots). The g-band fluxes of July 2021 (crosses) are adjusted to approximately match the WL fluxes.
Current usage metrics show cumulative count of Article Views (full-text article views including HTML views, PDF and ePub downloads, according to the available data) and Abstracts Views on Vision4Press platform.
Data correspond to usage on the plateform after 2015. The current usage metrics is available 48-96 hours after online publication and is updated daily on week days.
Initial download of the metrics may take a while.