Free Access
Fig. 1.
Download original image
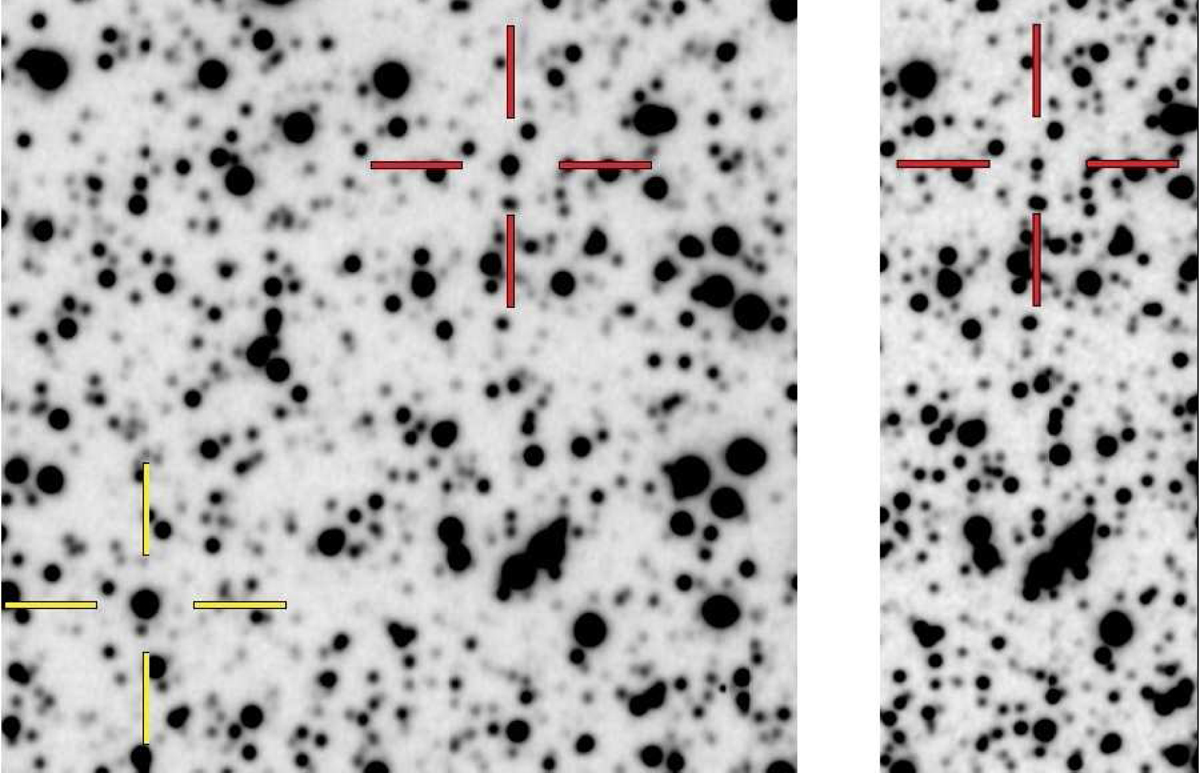
Finding chart for J183221.56-162724.25. The r-band images were taken on 12 May 2021 with MuSCAT3 on the FTN. N is up, E to the left, and sizes are 80″ × 80″ and 30″ × 80″. The target and the comparison star are indicated by the red and yellow crosses, respectively. The right panel shows the target in the eclipse.
Current usage metrics show cumulative count of Article Views (full-text article views including HTML views, PDF and ePub downloads, according to the available data) and Abstracts Views on Vision4Press platform.
Data correspond to usage on the plateform after 2015. The current usage metrics is available 48-96 hours after online publication and is updated daily on week days.
Initial download of the metrics may take a while.