Fig. 4.
Download original image
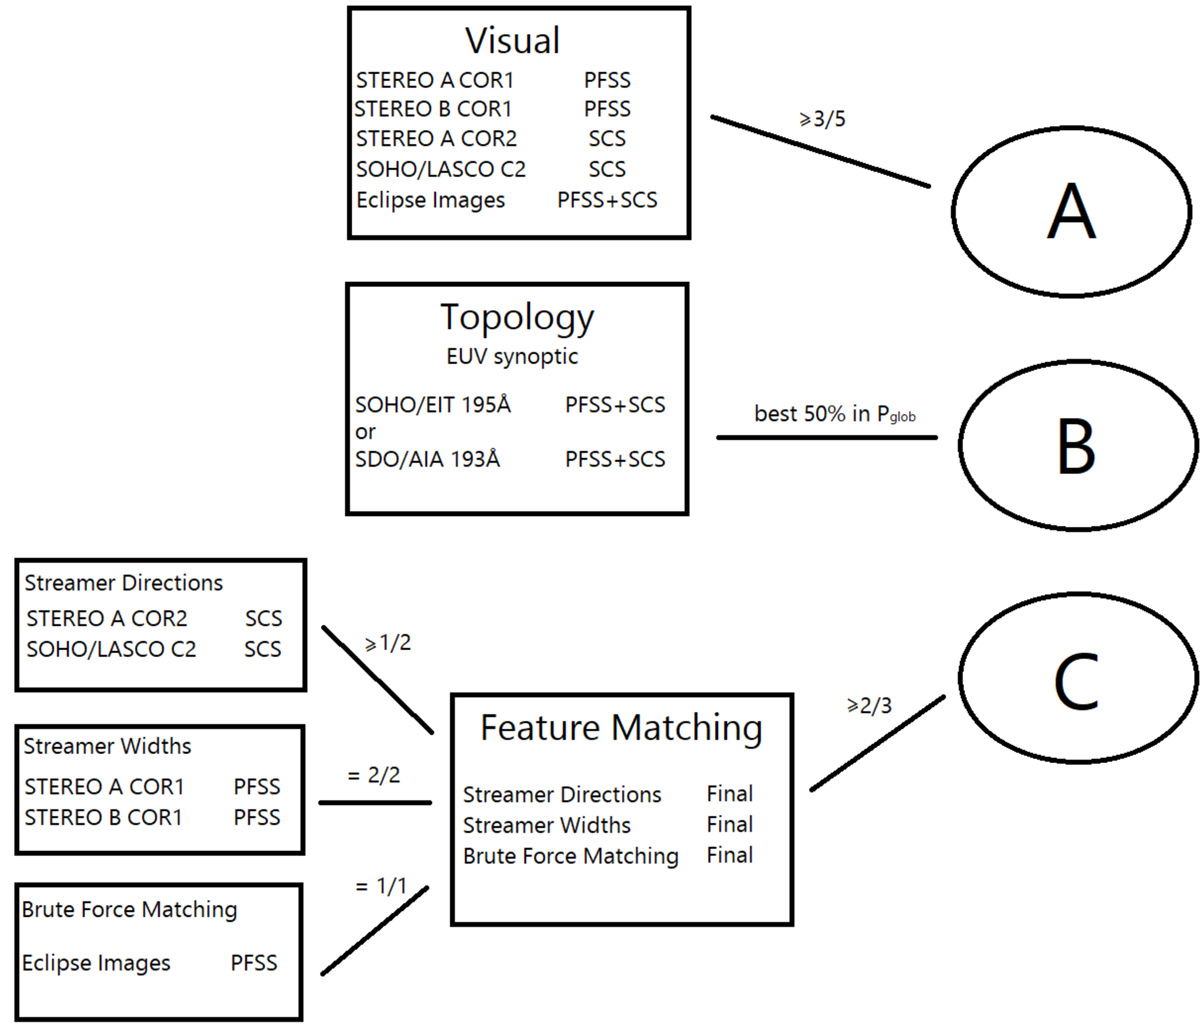
Workflow of our application of the benchmarking system to the EUHFORIA coronal model. In each box on the right, we show comparative images – except in the feature-matching box, where we show the results of each sub-step on the right. Configurations that passed the analysis given in the boxes are sorted into sets A, B, and C.
Current usage metrics show cumulative count of Article Views (full-text article views including HTML views, PDF and ePub downloads, according to the available data) and Abstracts Views on Vision4Press platform.
Data correspond to usage on the plateform after 2015. The current usage metrics is available 48-96 hours after online publication and is updated daily on week days.
Initial download of the metrics may take a while.