Fig. 2.
Download original image
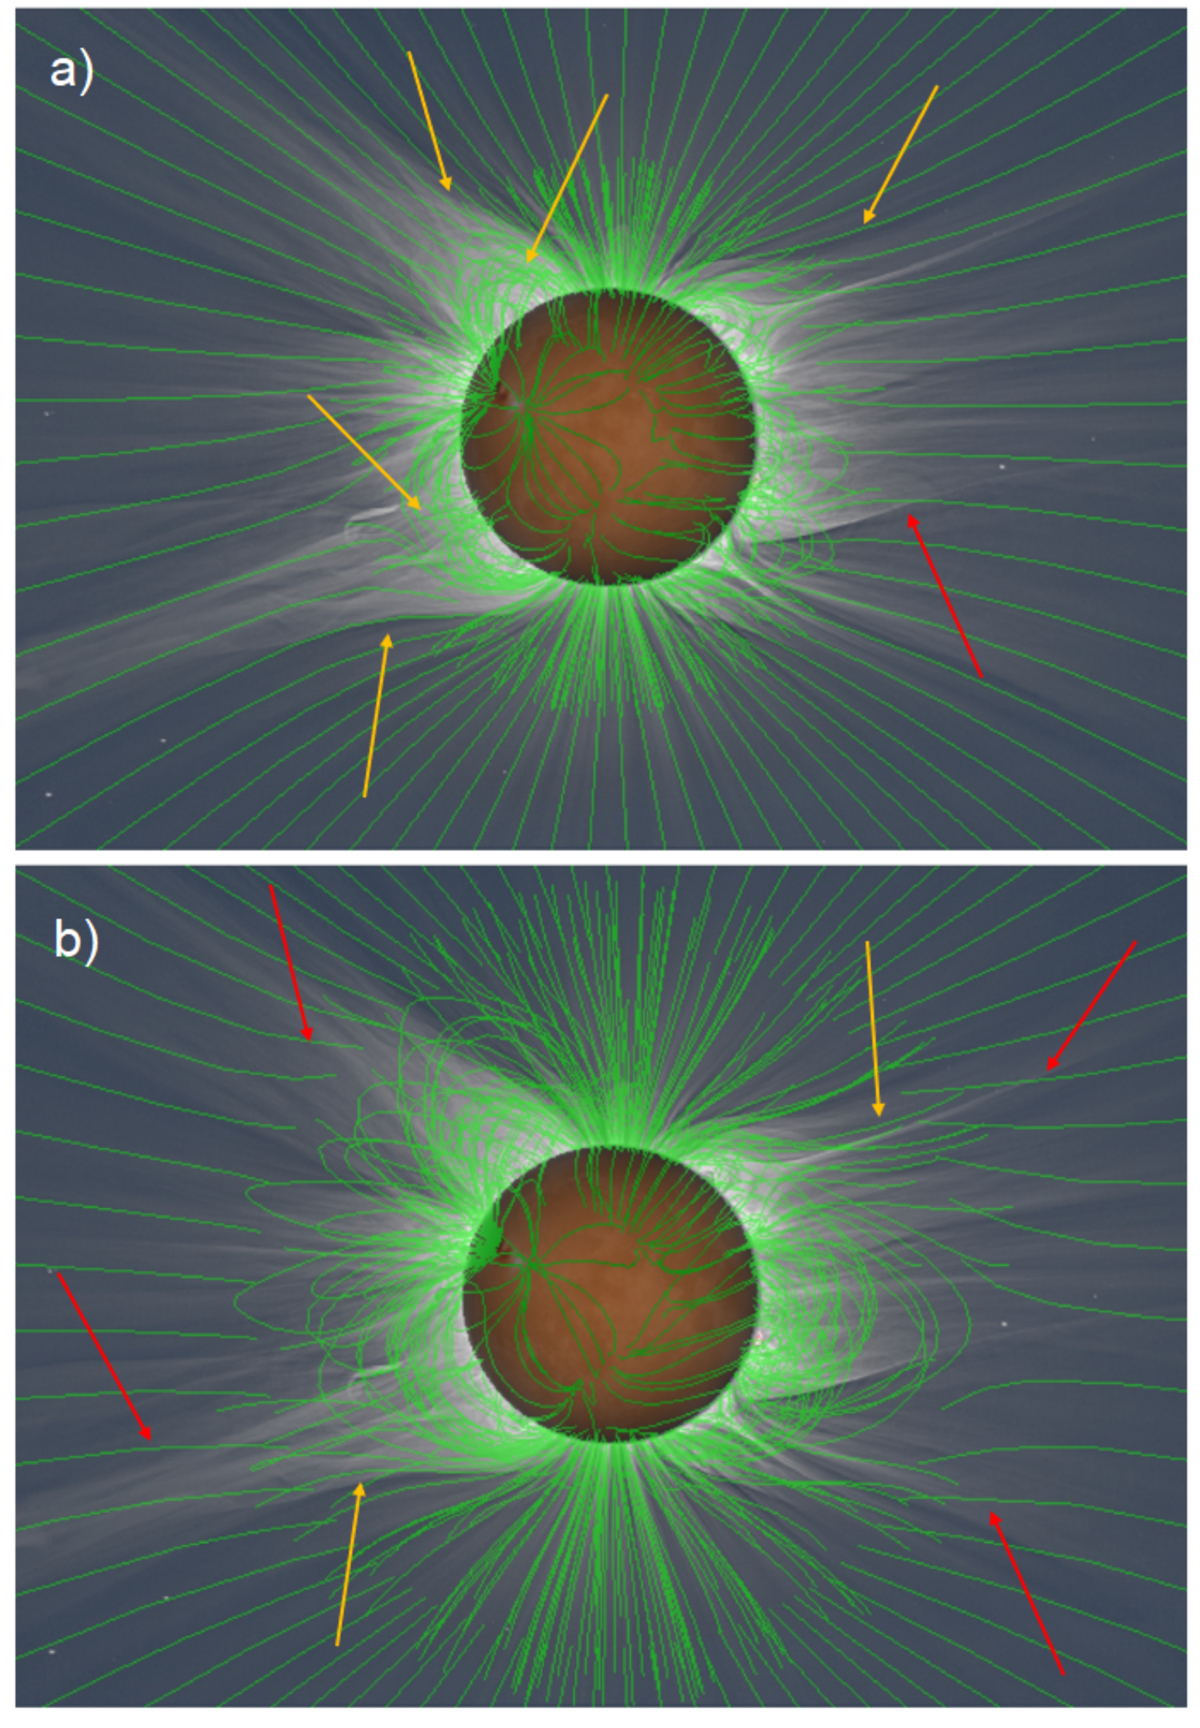
Illustration of visual classification process for two configurations on 11 Jul. 2010 overlaid on eclipse data. Yellow arrows mark good matches between observation and field line simulation, while red arrows mark mismatches. Panel a: thus shows a well-matching configuration (Rss = 1.9 R⊙ and Rscs = 1.5 R⊙), while the field line solution in (b) is rejected by our criteria (Rss = 2.8 R⊙ and Rscs = 2.4 R⊙).
Current usage metrics show cumulative count of Article Views (full-text article views including HTML views, PDF and ePub downloads, according to the available data) and Abstracts Views on Vision4Press platform.
Data correspond to usage on the plateform after 2015. The current usage metrics is available 48-96 hours after online publication and is updated daily on week days.
Initial download of the metrics may take a while.