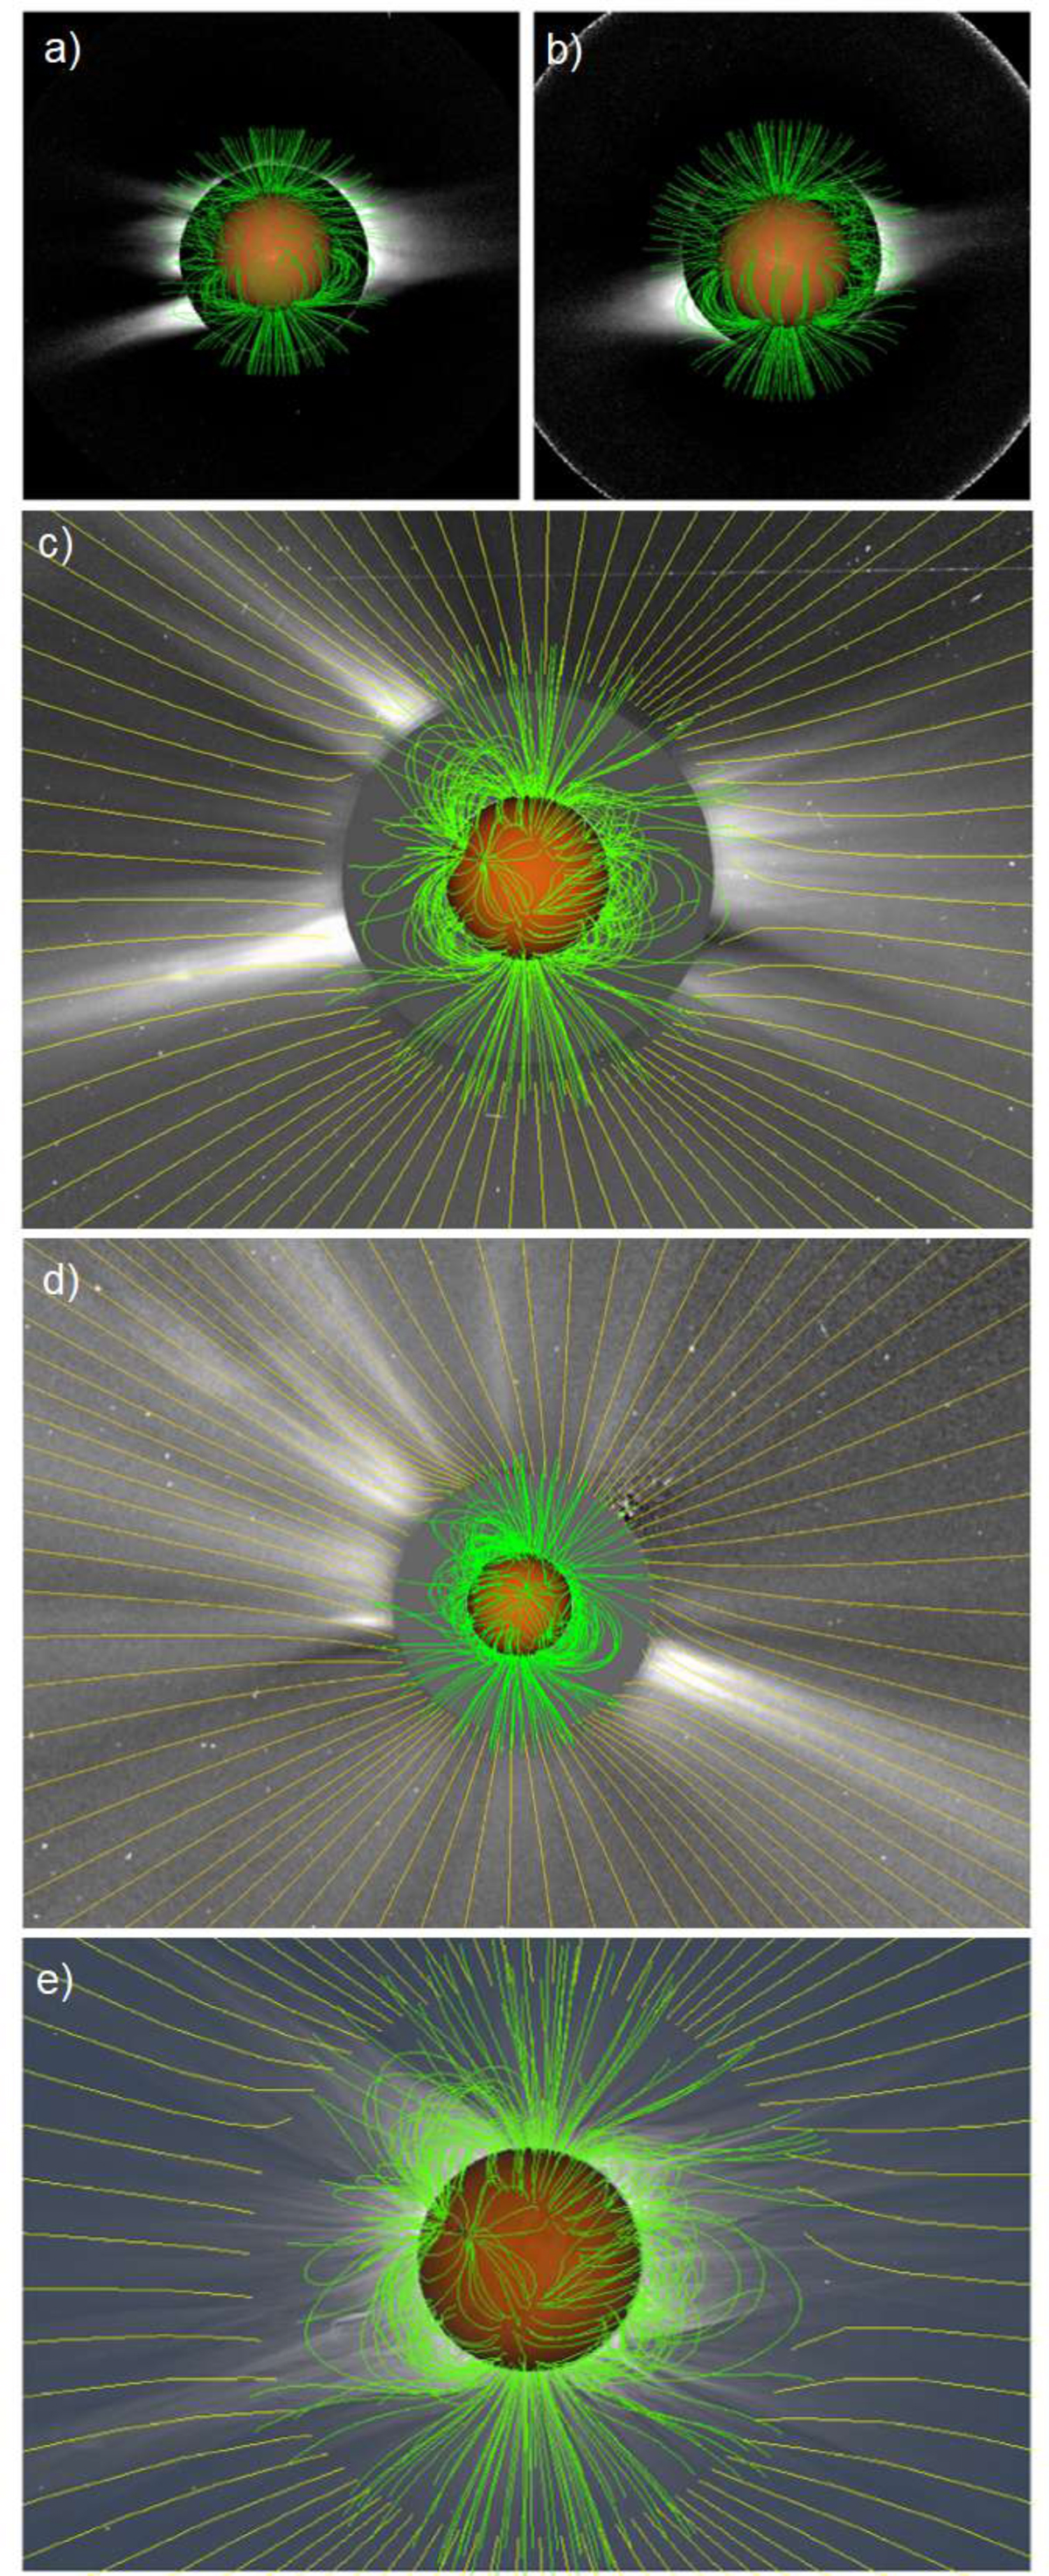
Fig. 1.
Download original image
Showcase of visualization of field lines (uniformly sampled) from the model, overplotted to observational white-light data from (a) STEREO B COR1, (b) STEREO A COR1, (c) SOHO LASCO C2, (d) STEREO A COR2, and (e) eclipse picture. The PFSS model is plotted as 3D field line configuration in green, while the SCS solution is plotted in a 2D plane-of-sky slice in yellow. In (a) and (b), Rss = 2.4 R⊙ for 1 Aug. 2008, while in (c), (d), and (e), Rss = 2.9 R⊙ and Rscs = 2.5 R⊙ for 11 Jul. 2010.
Current usage metrics show cumulative count of Article Views (full-text article views including HTML views, PDF and ePub downloads, according to the available data) and Abstracts Views on Vision4Press platform.
Data correspond to usage on the plateform after 2015. The current usage metrics is available 48-96 hours after online publication and is updated daily on week days.
Initial download of the metrics may take a while.