Fig. 9.
Download original image
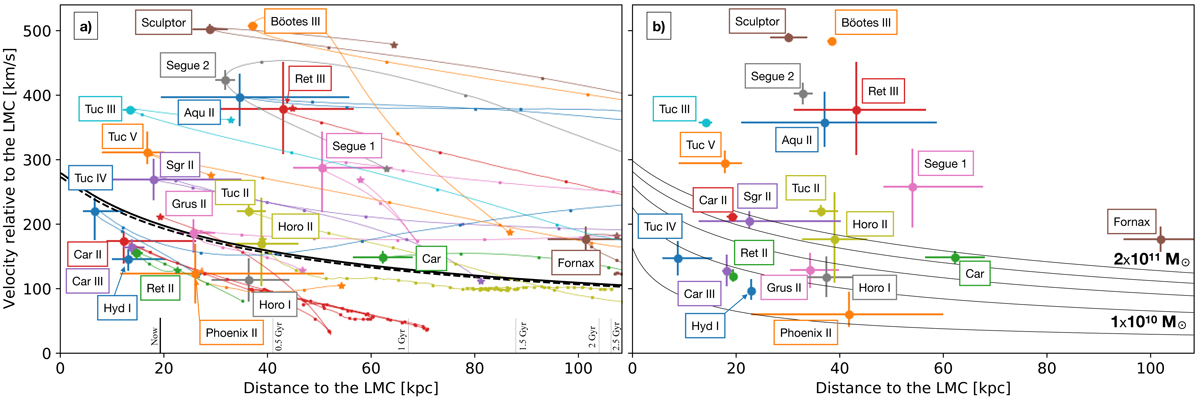
Left panel: relative distance and velocity for the galaxies for which at least one of the 100 orbit realisations in the perturbed potential pass close to the LMC (< 60 kpc). The black line represents the escape velocity of the initial a 1.5 × 10¹¹ M⊙ LMC represented by a NFW profile with a scale radius rs = 10.84 kpc, while the dashed line shows the escape velocity of the current LMC. Each coloured line shows the evolution of the relative distance and velocity of the galaxies with each point marking 100 Myr of evolution. For the galaxies that are not currently at their closest approach, the triangles show their current position on this diagram. The vertical lines at the bottom of the panel show the location of the Jacobi radius at different epochs. Right panel: same as the left panel but assuming that the LMC follows the orbit of a point mass, and does not modify the MW potential. The black lines represent the escape velocity for a LMC with a mass of respectively 1, 5, 10, 15 and 20 × 1010 M⊙ and a scale radius that respect the observational constraint following the requirement of Vasiliev et al. (2021).
Current usage metrics show cumulative count of Article Views (full-text article views including HTML views, PDF and ePub downloads, according to the available data) and Abstracts Views on Vision4Press platform.
Data correspond to usage on the plateform after 2015. The current usage metrics is available 48-96 hours after online publication and is updated daily on week days.
Initial download of the metrics may take a while.