Fig. 6.

Download original image
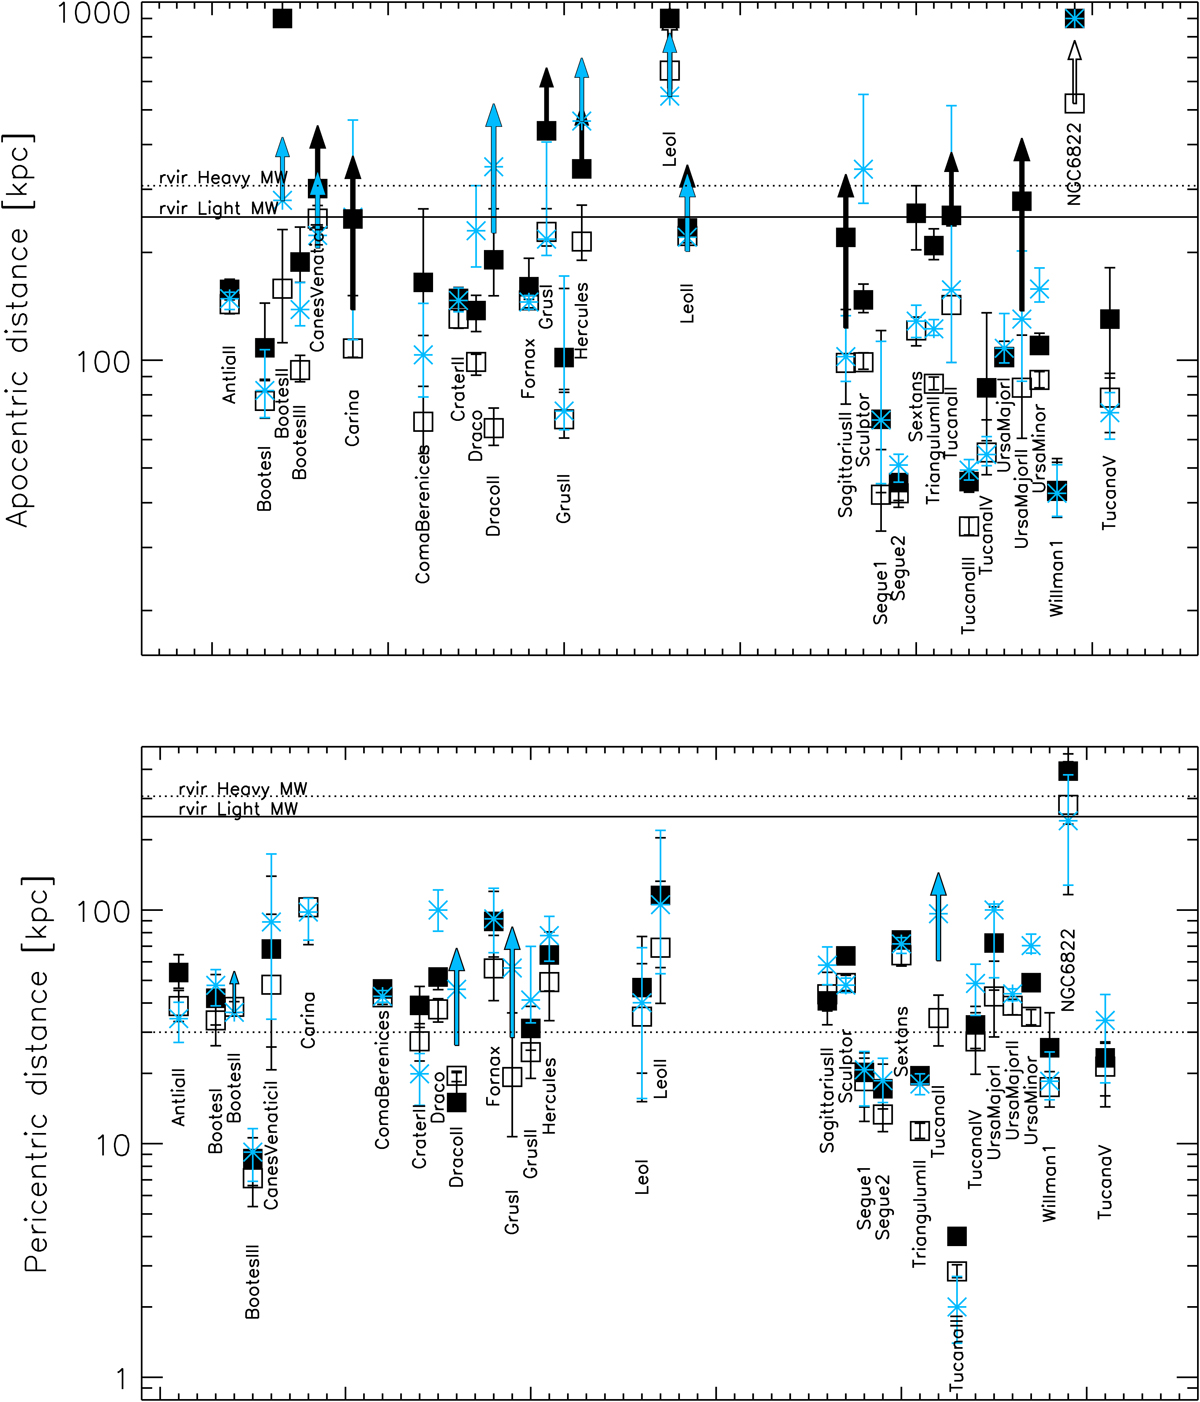
Apocentric (top) and pericentric (bottom) distance for the sample of likely MW satellite galaxies (excluding the high likely long-term LMC satellites of the LMC in Table 2) with error in 3D velocity less than 70 km s−1. The filled and open squares show the results for the “Light” and “Heavy” isolated MW potentials and the light blue asterisks for the perturbed potential. The arrows indicate those cases where either the median or the 84th percentiles were undefined. When not even the 16th percentile was defined, the symbols are placed at an apocentric distance = 900 kpc. We only consider cases where the galaxy has already experienced a pericentric passage. The horizontal lines that have a label indicate the virial radius of the DM halo in the corresponding gravitational potential; the line at a distance of 30 kpc is meant to indicate a region potentially dangerous in terms of tidal effects (see main text).
Current usage metrics show cumulative count of Article Views (full-text article views including HTML views, PDF and ePub downloads, according to the available data) and Abstracts Views on Vision4Press platform.
Data correspond to usage on the plateform after 2015. The current usage metrics is available 48-96 hours after online publication and is updated daily on week days.
Initial download of the metrics may take a while.


