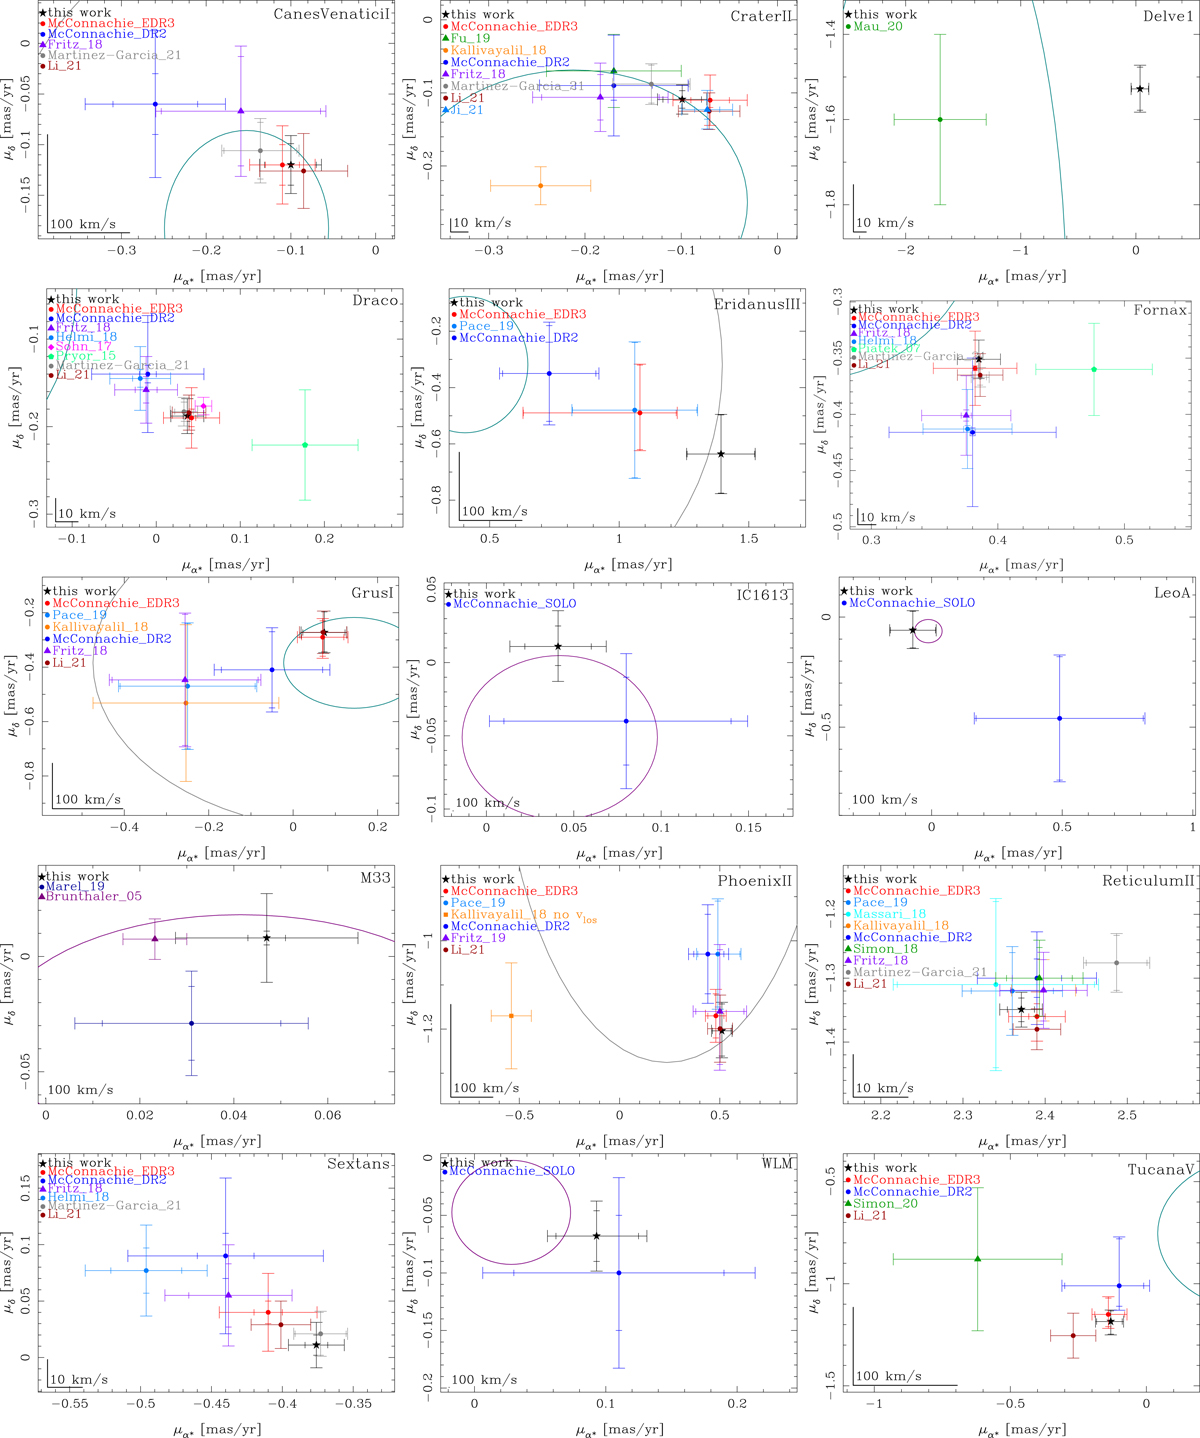
Fig. 5.
Download original image
Comparison of our systemic PM measurements (labelled “This work”, shown as a black star) with literature measurements. The Gaia measurements are from Gaia Collaboration (2018b), Simon (2018), Simon et al. (2020), Fritz et al. (2018a, 2019), Carlin & Sand (2018), Massari & Helmi (2018), Kallivayalil et al. (2018), Pace & Li (2019), Pace et al. (2020), Fu et al. (2019), McConnachie & Venn (2020a,b), Longeard et al. (2018, 2020), Torrealba et al. (2019), Mau et al. (2020), Cerny et al. (2021), Chakrabarti et al. (2019), Gregory et al. (2020), Mutlu-Pakdil et al. (2019), Jenkins et al. (2021), Vasiliev & Baumgardt (2021), Martínez-García et al. (2021), Li et al. (2021a), Ji et al. (2021). Triangles indicate works that used only stars with additional information on membership, usually from spectroscopy, but also RR Lyrae variable stars in some cases, as Simon (2018). HST measurements are from Piatek et al. (2003, 2005, 2006, 2007), Pryor et al. (2015), Piatek et al. (2016), Sohn et al. (2013, 2017). Among them, those indicated by diamonds (pentagons) use background galaxies (QSOs) as references. The smaller error bars include only the random Gaia error, the larger one also the systematic error when they are given as separated in the source. We do not display the correlation between the PMs components here. The ellipses (when in the field of view of the plots) indicate the σ = 100 km s−1 prior (green) of McConnachie & Venn (2020a,b), and the escape velocity (grey) in the 1.6 × 10¹² M⊙ Milky Way of Fritz et al. (2018a) centred on the expected reflex motion for the system. For galaxies at a distance > 500 kpc, we only plot an ellipse (purple) corresponding to 200 km s−1.
Current usage metrics show cumulative count of Article Views (full-text article views including HTML views, PDF and ePub downloads, according to the available data) and Abstracts Views on Vision4Press platform.
Data correspond to usage on the plateform after 2015. The current usage metrics is available 48-96 hours after online publication and is updated daily on week days.
Initial download of the metrics may take a while.