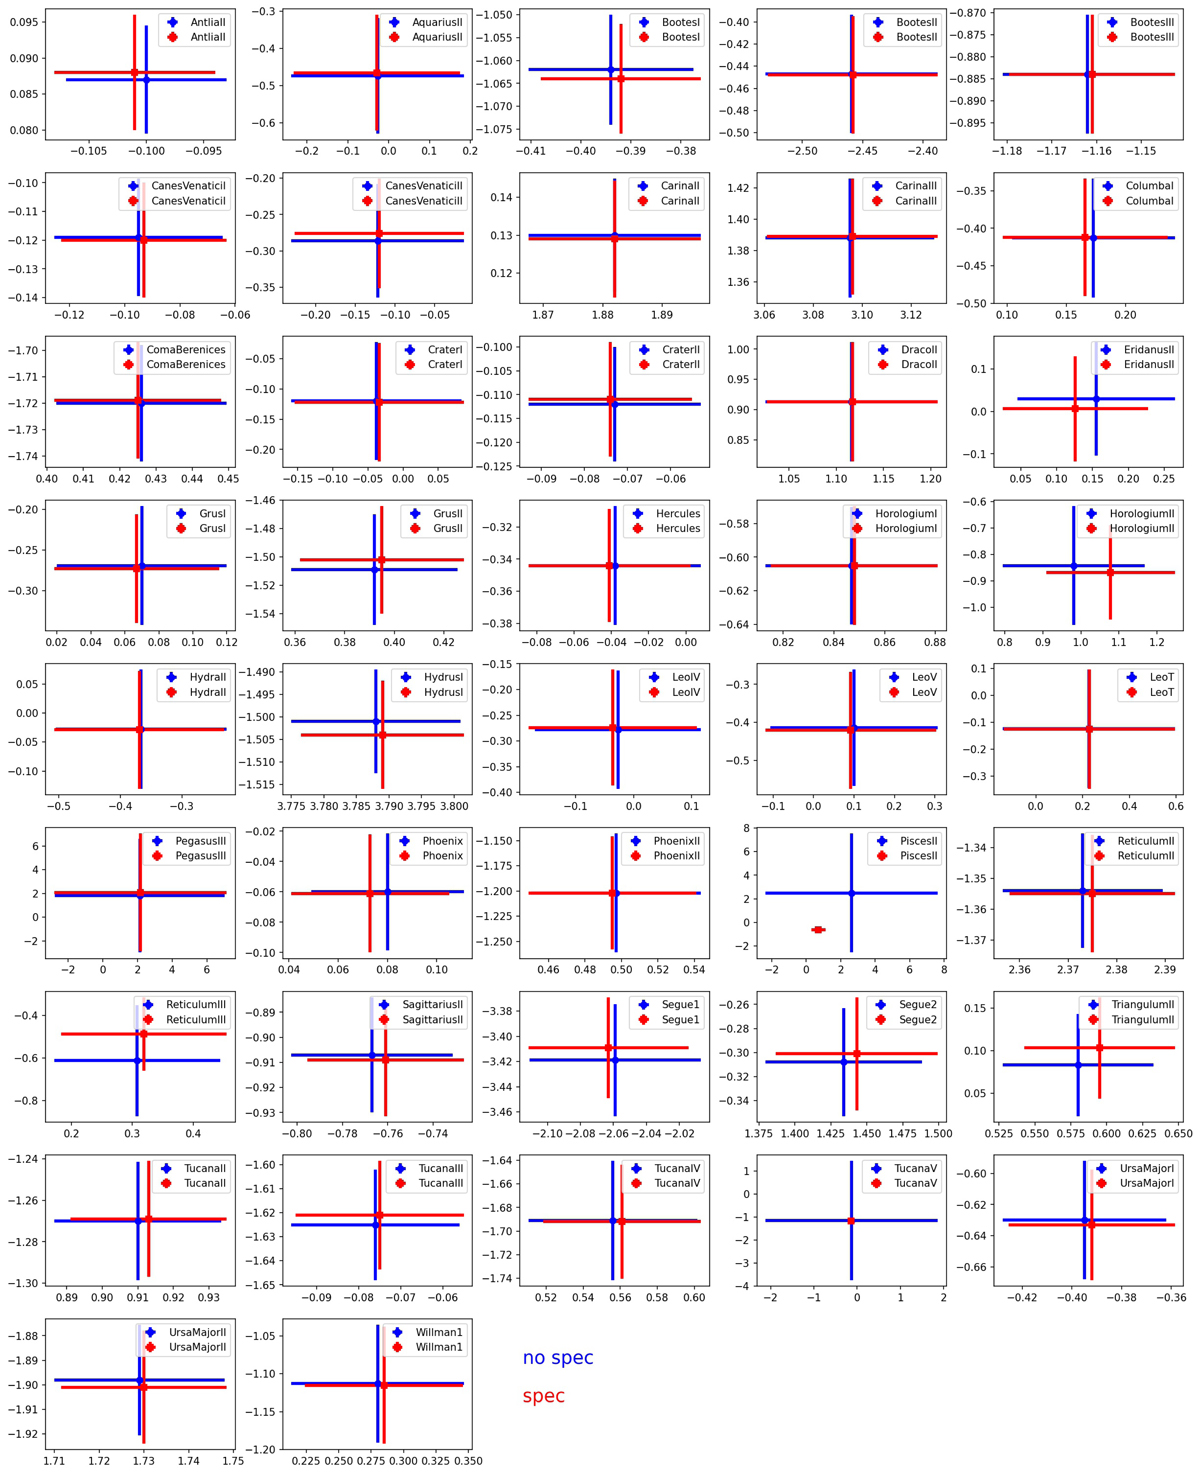
Fig. C.2.
Download original image
Comparison of systemic PMs determined with (red) and without (blue) the likelihood term for line-of-sight velocities. The x-axis and y-axis show the μα, * and μδ component, respectively. The sources of the spectroscopic works are those used in Fritz et al. (2018a, see references to the original studies therein), Kirby et al. (2013b), Kirby et al. (2015), Carlin & Sand (2018), Torrealba et al. (2019), Simon et al. (2020), Longeard et al. (2021).
Current usage metrics show cumulative count of Article Views (full-text article views including HTML views, PDF and ePub downloads, according to the available data) and Abstracts Views on Vision4Press platform.
Data correspond to usage on the plateform after 2015. The current usage metrics is available 48-96 hours after online publication and is updated daily on week days.
Initial download of the metrics may take a while.