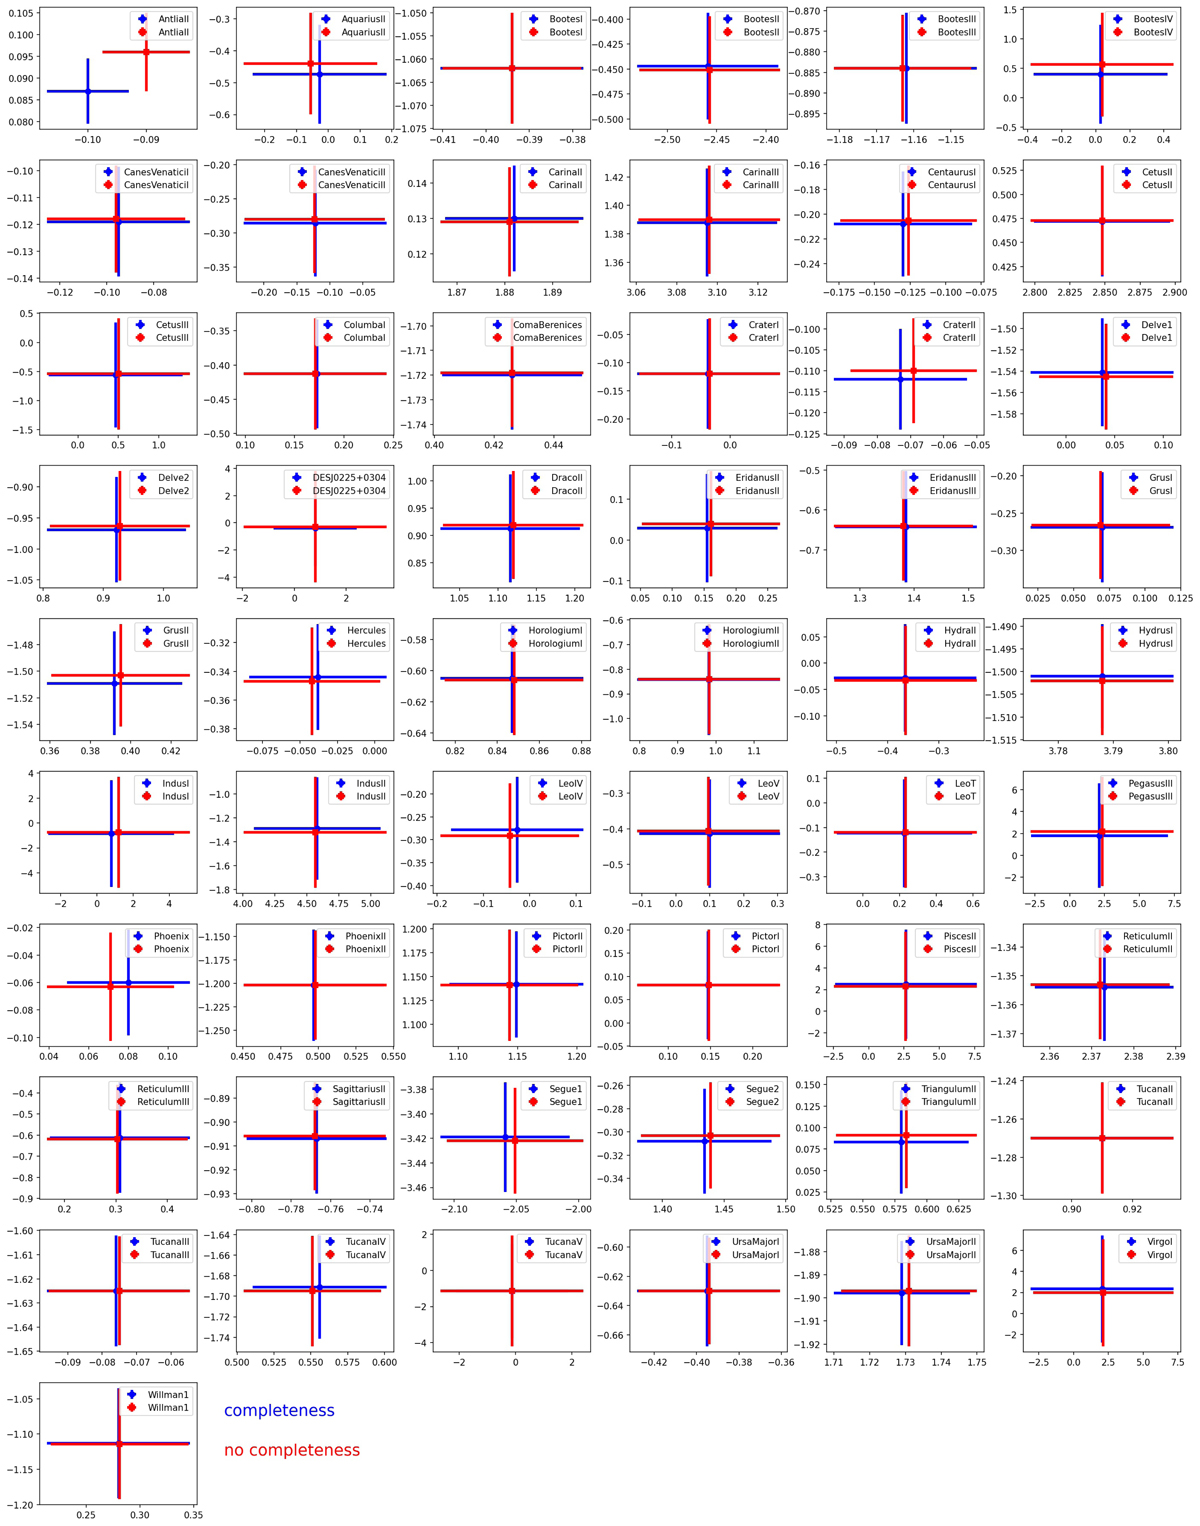
Fig. C.1.
Download original image
Comparison of systemic PMs determined with (blue) and without (red) the correction for the photometric completeness of Gaia eDR3 data, for the systems whose CMD probability distribution was calculated using a synthetic CMD (see Tab. 1), in the run not including spectroscopic information. The x-axis and y-axis show the μα, * and μδ component, respectively.
Current usage metrics show cumulative count of Article Views (full-text article views including HTML views, PDF and ePub downloads, according to the available data) and Abstracts Views on Vision4Press platform.
Data correspond to usage on the plateform after 2015. The current usage metrics is available 48-96 hours after online publication and is updated daily on week days.
Initial download of the metrics may take a while.