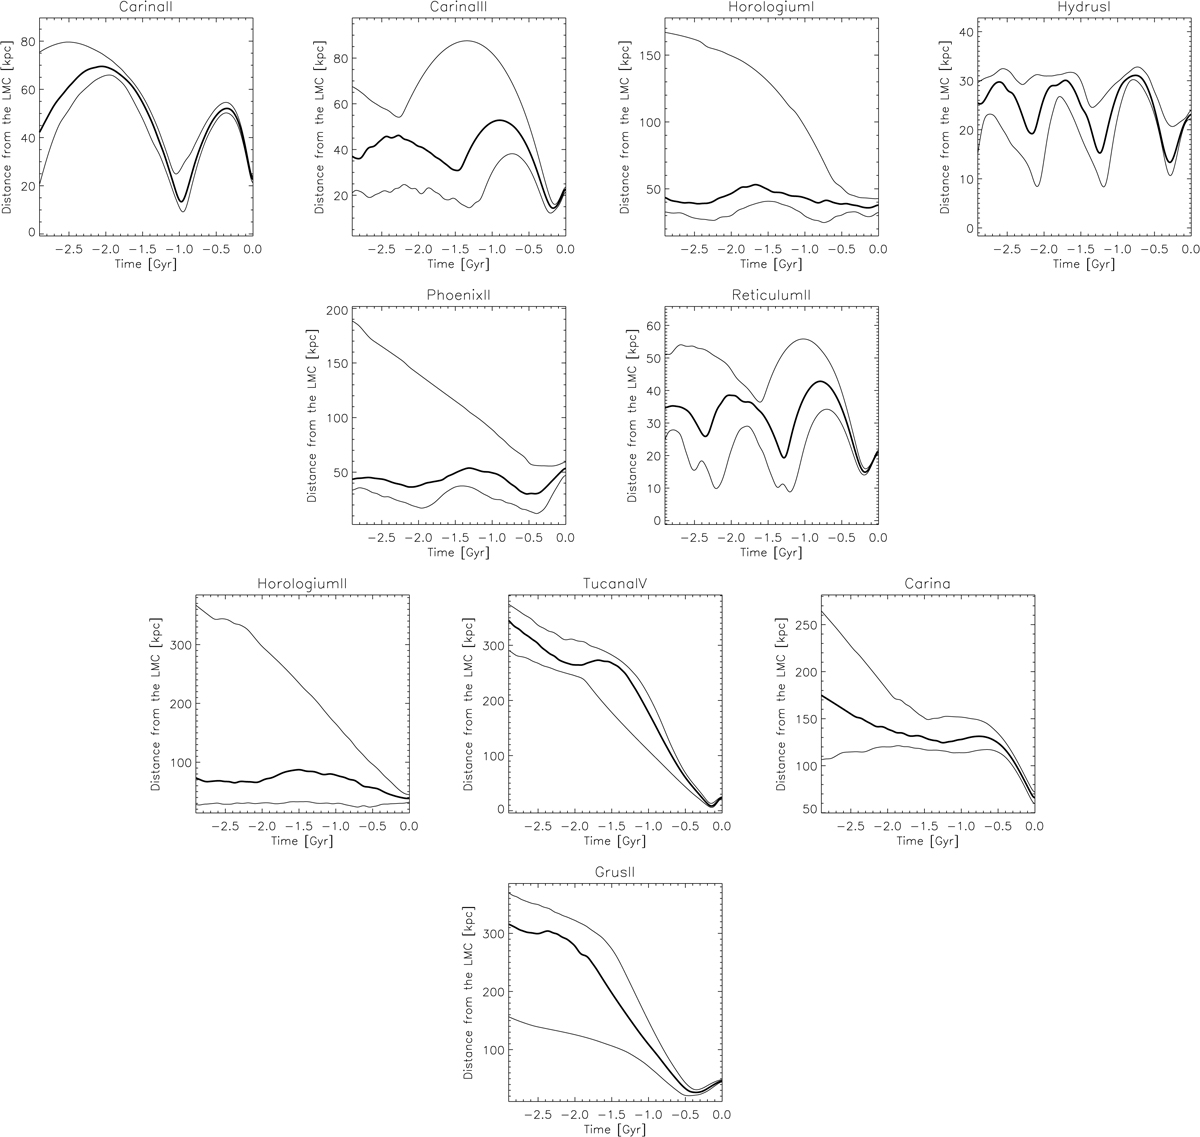
Fig. 10.
Download original image
Distance from the LMC as a function of time for the last 3 Gyr. The thicker line gives the median of the 100 random realisations and the thinner lines the 16th and 84th percentiles. The first and second row from the top depict the likely long term satellites of the LMC; the third row the possible long term satellites of the LMC and the last row the recently captured satellites.
Current usage metrics show cumulative count of Article Views (full-text article views including HTML views, PDF and ePub downloads, according to the available data) and Abstracts Views on Vision4Press platform.
Data correspond to usage on the plateform after 2015. The current usage metrics is available 48-96 hours after online publication and is updated daily on week days.
Initial download of the metrics may take a while.