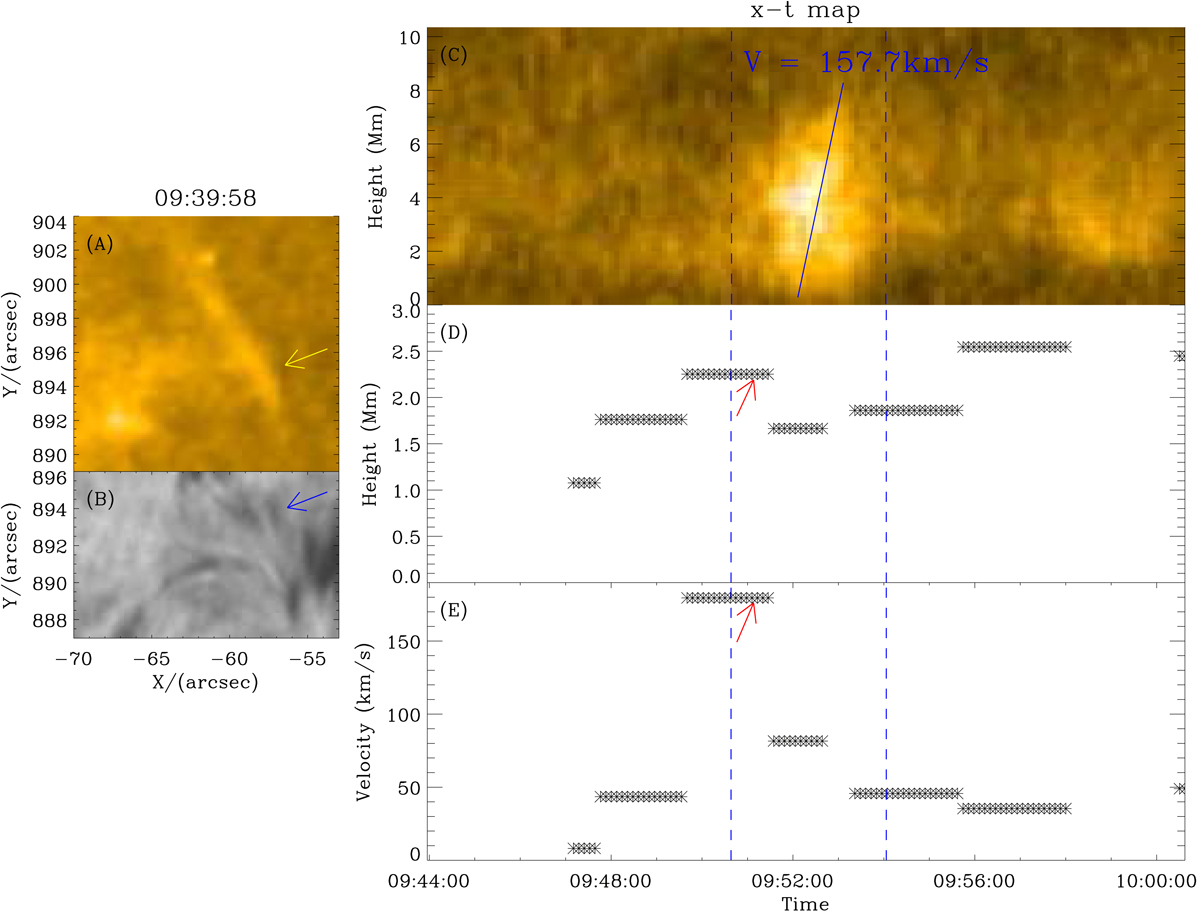
Fig. 7.
Download original image
Case analysis of the relationship between coronal jet and Hα jet. Snapshot showing the connection between Hα jets in the NVST Hα − 0.6 Å (B) and coronal jet in the AIA 171 Å (A). The yellow arrow outlines the structures of coronal jet determined from panel A, while the blue arrow represents the Hα jets from panel B. Time-slice images of the coronal jet is shown in panel C, the velocity is 158 km s−1. Panels D and E: maximum height and ascending velocity of the Hα jets that exist in the footpoint of the given coronal jet (see those denoted by the red arrows). The blue dashed lines indicate the location of the coronal jet. See animation online.
Current usage metrics show cumulative count of Article Views (full-text article views including HTML views, PDF and ePub downloads, according to the available data) and Abstracts Views on Vision4Press platform.
Data correspond to usage on the plateform after 2015. The current usage metrics is available 48-96 hours after online publication and is updated daily on week days.
Initial download of the metrics may take a while.