Fig. 1.
Download original image
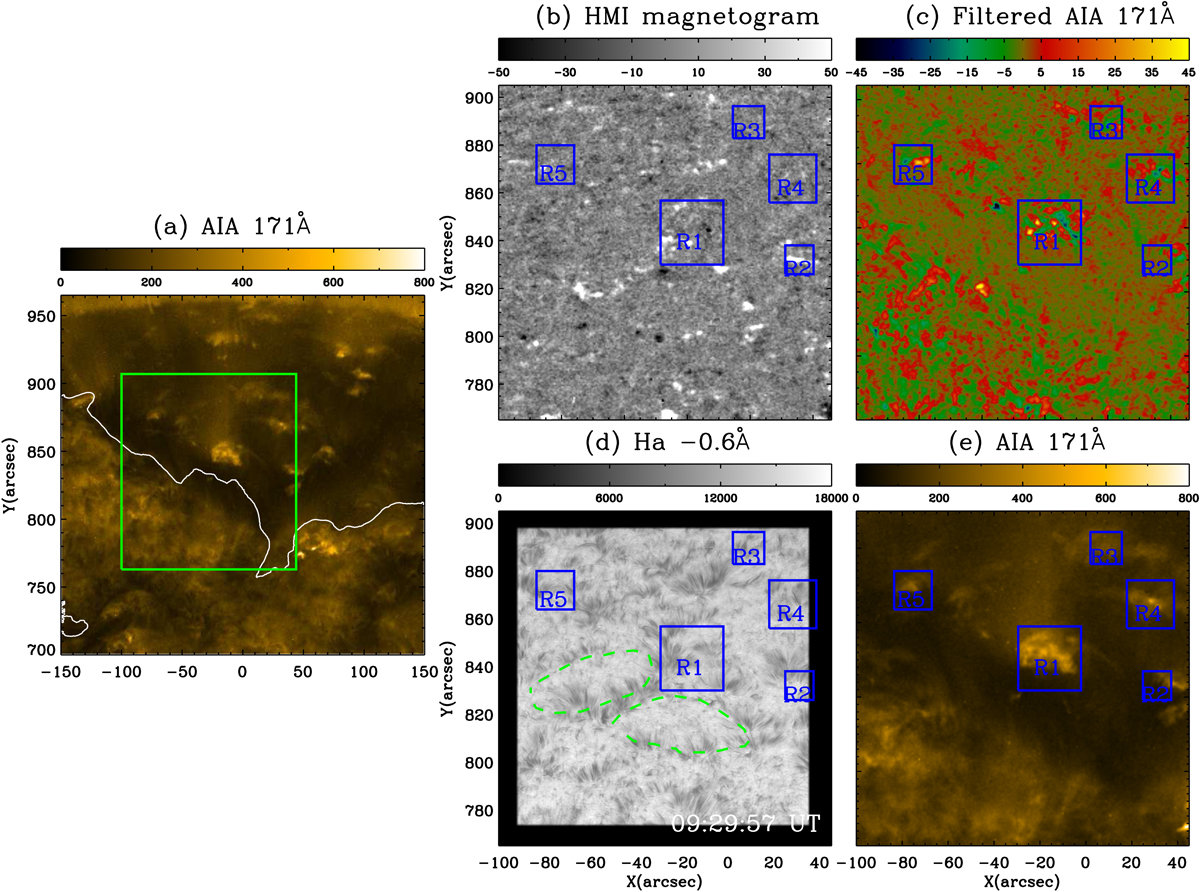
Context images for regions studied in the present work taken on 2018 September 15. The AIA 171 Å image is giving an overview of the coronal structures in and around the studied regions (a). The contours (white lines) outline the boundaries of the coronal holes determined from the AIA 193 Å image. The region enclosed by the rectangle (green lines) is zoomed-in in panels b–e. The region of interest seen with HMI magnetic features (b), AIA 171 Å filtered (10−30 min) image (c), NVST Hα − 0.6 Å image (d) and AIA 171 Å image (e) is shown. The rectangles (blue lines) in panels b–e mark the network regions where coronal plumes are clearly seen. The green dotted lines in panel d mark two full and clear network regions. See animation online.
Current usage metrics show cumulative count of Article Views (full-text article views including HTML views, PDF and ePub downloads, according to the available data) and Abstracts Views on Vision4Press platform.
Data correspond to usage on the plateform after 2015. The current usage metrics is available 48-96 hours after online publication and is updated daily on week days.
Initial download of the metrics may take a while.