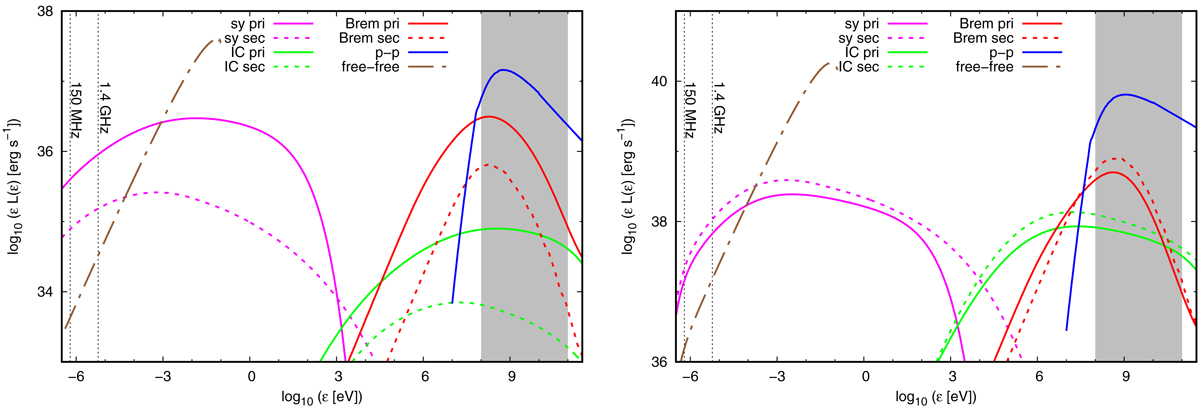
Fig. B.1.
Download original image
SEDs computed from scenario 0, for typical cases of low (Ṁ∗ = 0.1 M⊙/yr, left) and high (Ṁ∗ = 10 M⊙/yr, right) SFRs. The coloured lines (solid for the primary CRs and dashed for the secondary CRs) are the individual contributions of different non-thermal radiative mechanisms (the colour-coding is the same as in Fig. 2). The dashed brown line is the thermal free-free emission; the grey shaded region represents the Fermi-LAT energy range; and the vertical dotted black lines show the studied radio frequencies (150 MHz and 1.4 GHz).
Current usage metrics show cumulative count of Article Views (full-text article views including HTML views, PDF and ePub downloads, according to the available data) and Abstracts Views on Vision4Press platform.
Data correspond to usage on the plateform after 2015. The current usage metrics is available 48-96 hours after online publication and is updated daily on week days.
Initial download of the metrics may take a while.