Free Access
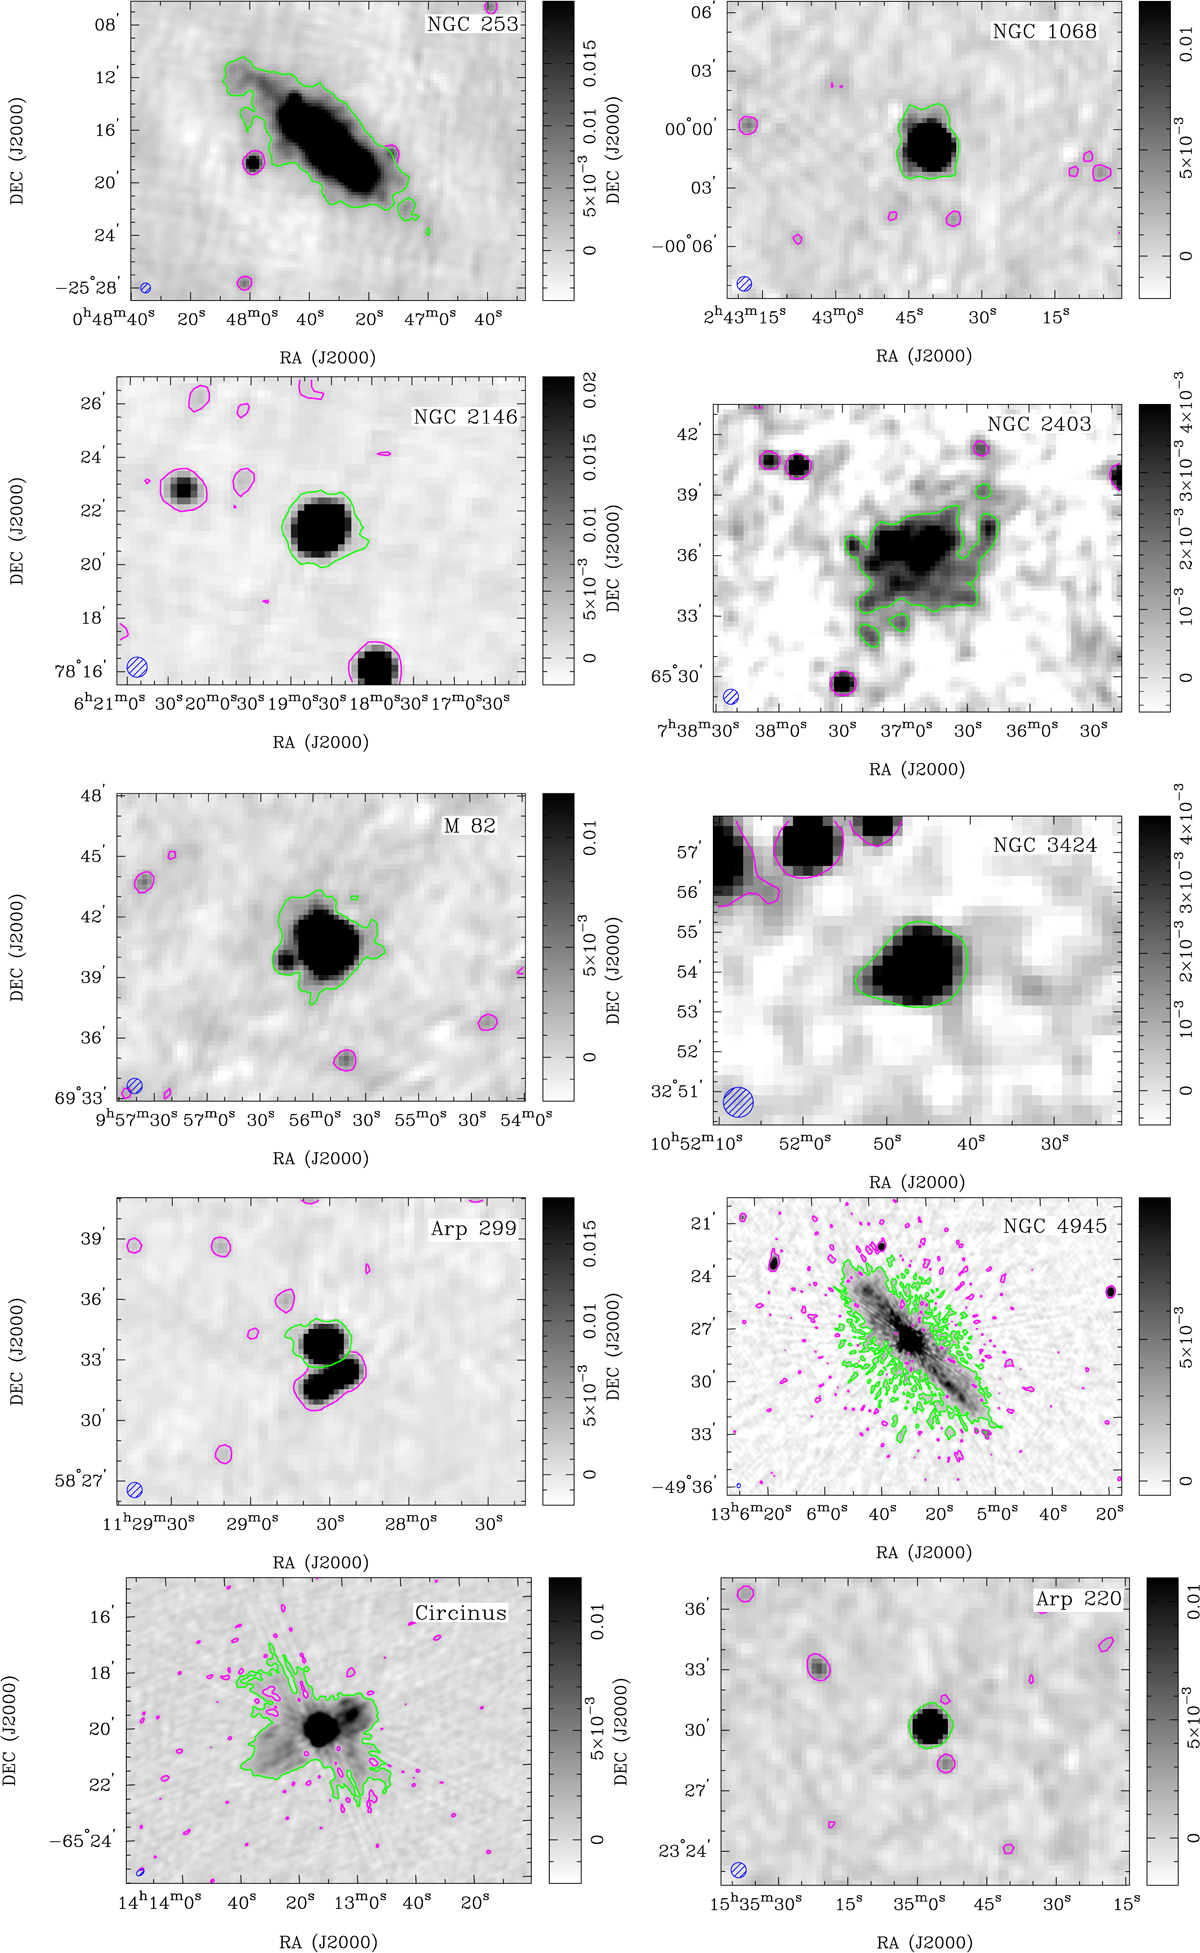
Fig. A.1.
Download original image
Stokes-I continuum image at 1.4 GHz for each galaxy in our sample. The flux scale is in Jy beam−1. The magenta contours indicate the 3σ level and the green solid contour the region selected for the flux integration. The synthesised beam is shown with a blue circle at the bottom left corner of each image.
Current usage metrics show cumulative count of Article Views (full-text article views including HTML views, PDF and ePub downloads, according to the available data) and Abstracts Views on Vision4Press platform.
Data correspond to usage on the plateform after 2015. The current usage metrics is available 48-96 hours after online publication and is updated daily on week days.
Initial download of the metrics may take a while.