Fig. 5.
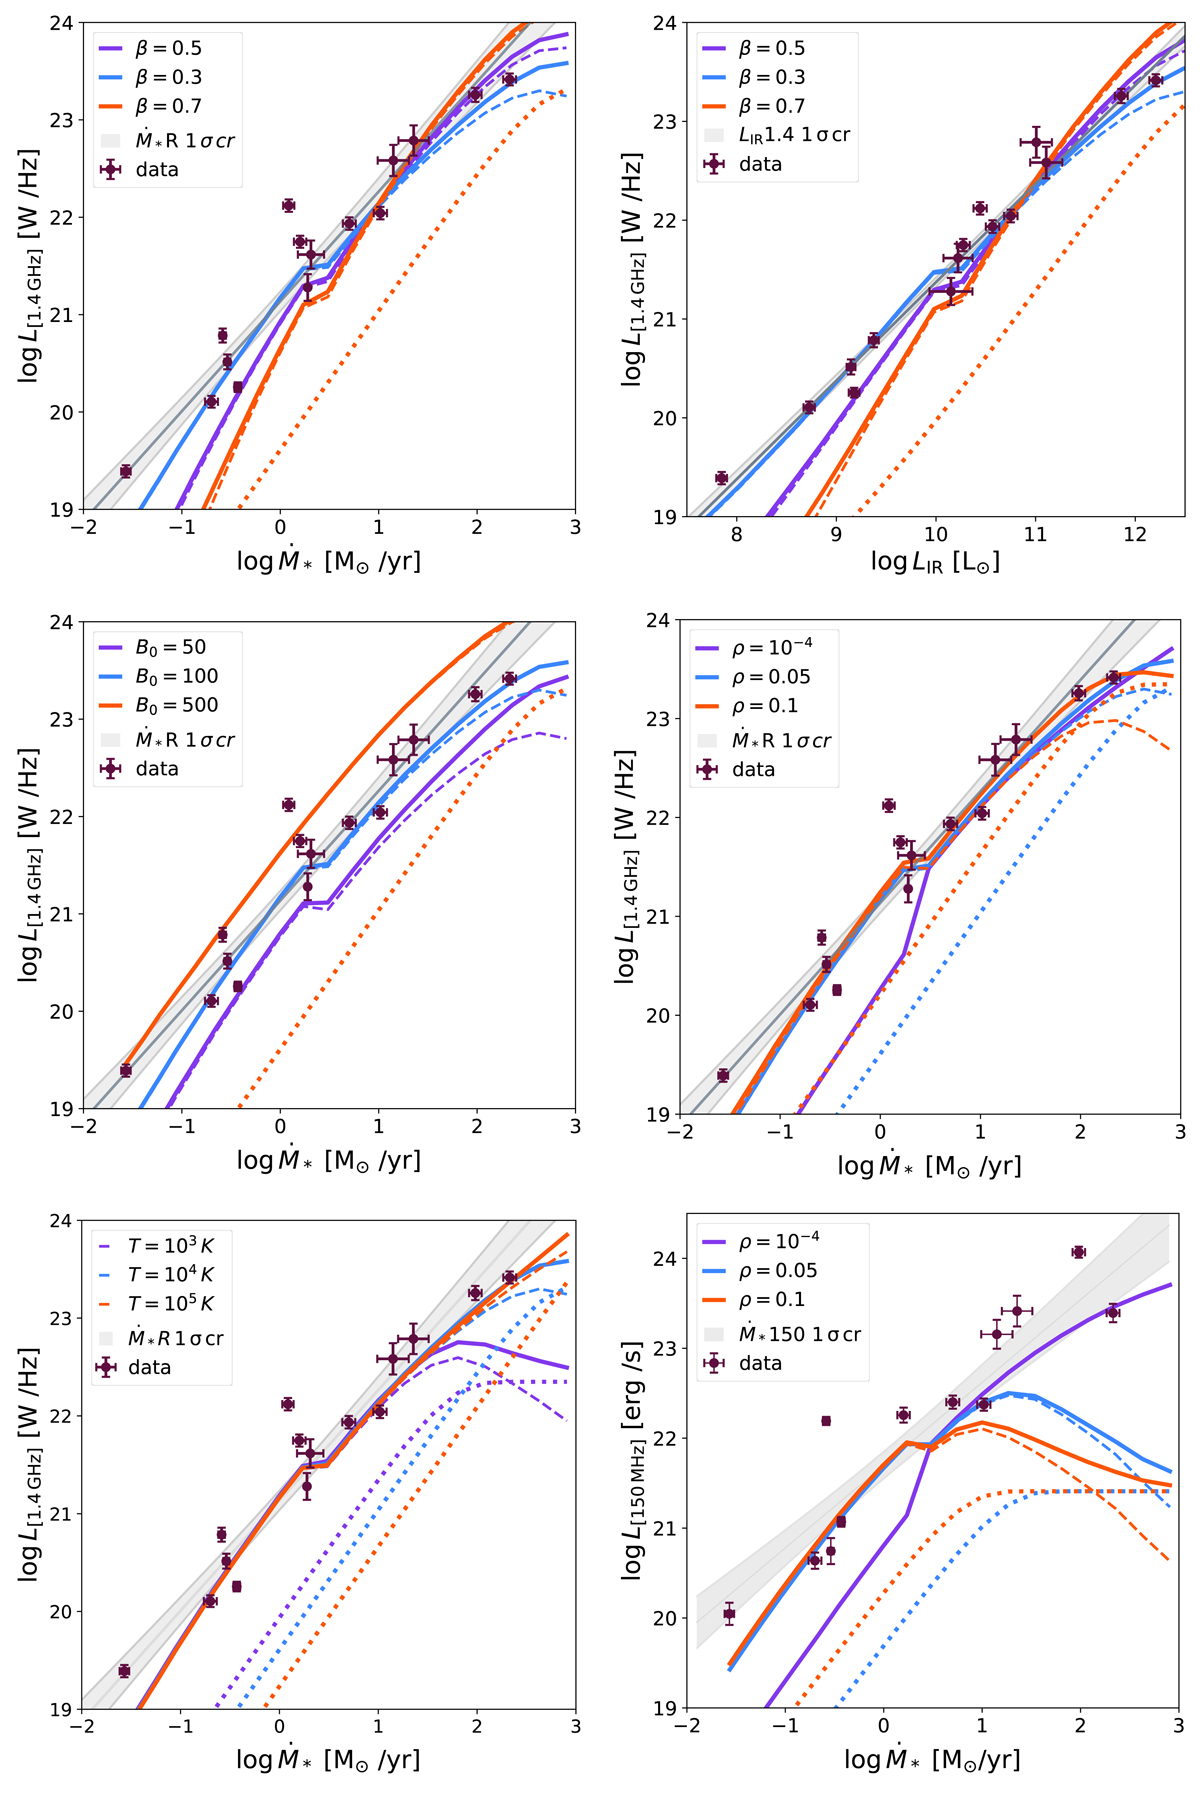
Download original image
Model relations for the different scenarios considered (Table 2). The grey shaded band indicates the 1σ confidence region of each fit (grey solid line) to the data sample (purple points). In all panels the dotted lines represent the thermal emission, the dashed lines the non-thermal emission, and the solid line the total emission. Upper panel: for scenarios (0), (1), and (2) the L1.4 GHz–SFR relation (left) and the L1.4 GHz–LIR relation (right) are shown. Middle panel: for scenarios (0), (3), and (4) (left) and (0), (5), and (6) (right) the L1.4 GHz–SFR relation is shown. Bottom panel: for scenarios (0), (7), and (8) the L1.4 GHz–SFR relation (left) is shown and for scenarios (0), (5), and (6) the L150 MHz–SFR relation (right) is shown.
Current usage metrics show cumulative count of Article Views (full-text article views including HTML views, PDF and ePub downloads, according to the available data) and Abstracts Views on Vision4Press platform.
Data correspond to usage on the plateform after 2015. The current usage metrics is available 48-96 hours after online publication and is updated daily on week days.
Initial download of the metrics may take a while.